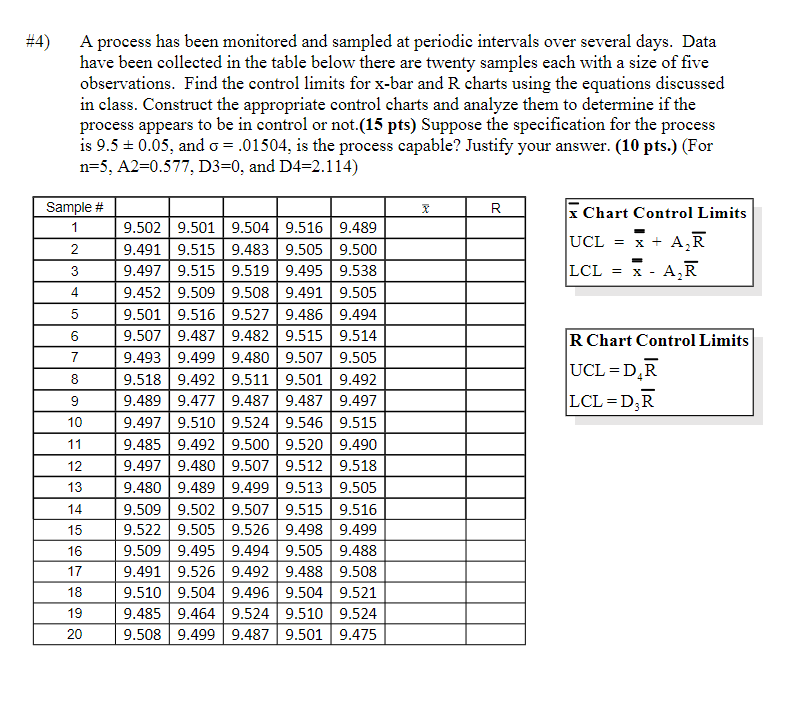
Question: # 4) A process has been monitored and sampled at periodic intervals over several days. Data have been collected in the table below there are

# 4) A process has been monitored and sampled at

# 4) A process has been monitored and sampled at periodic intervals over several days. Data have been collected in the table below there are twenty samples each with a size of five observations. Find the control limits for x-bar and R charts using the equations discussed in class. Construct the appropriate control charts and analyze them to determine if the process appears to be in control or not.(15 pts) Suppose the specification for the process is 9.50.05, and o= .01504, is the process capable? Justify your answer. (10 pts.) (For n=5, A2=0.577, D3=0, and D4=2.114) X R Sample # 1 Chart Control Limits UCL = x + AR 9.502 9.501 9.504 9.516 9.489 9.491 9.515 9.483 9.505 9.500 9.497 9.515 9.519 9.495 9.538 2 3 LCL = x AR 9.452 9.509 9.508 9.491 9.505 9.494 9.501 9.516 9.527 9.486 9.514 R Chart Control Limits 9.507 9.487 9.482 9.515 9.493 9.499 9.480 9.507 9.505 UCL =DR 9.511 9.501 9.492 9.518 9.492 9.489 9.477 9.487 9.487 9.497 LCL =DR 9.497 9.510 9.524 9.546 9.515 9.485 9.492 9.500 9.520 9.490 9.497 9.480 9.507 9.512 9.518 9.480 9.489 9.499 9.513 9.505 9.509 9.502 9.507 9.515 9.516 9.522 9.505 9.526 9.498 9.499 9.509 9.495 9.494 9.505 9.488 9.491 9.526 9.492 9.488 9.508 9.510 9.504 9.496 9.504 9.521 9.485 9.464 9.524 9.510 9.524 9.508 9.499 9.487 9.501 9.475 4 5 6 7 8 9 10 11 12 13 14 15 16 17 18 19 20

Step by Step Solution

There are 3 Steps involved in it

1 Expert Approved Answer
Step: 1 Unlock blur-text-image
Question Has Been Solved by an Expert!

Get step-by-step solutions from verified subject matter experts

Step: 2 Unlock
Step: 3 Unlock

Students Have Also Explored These Related General Management Questions!