

Question: A process bas been monitored and sampled at periodic intervals over several days. Data have been collected in the table below. there are twenty samples
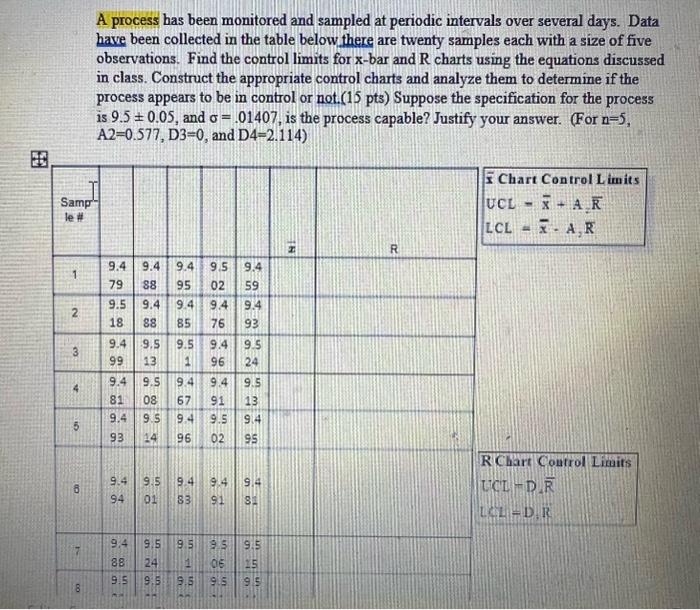
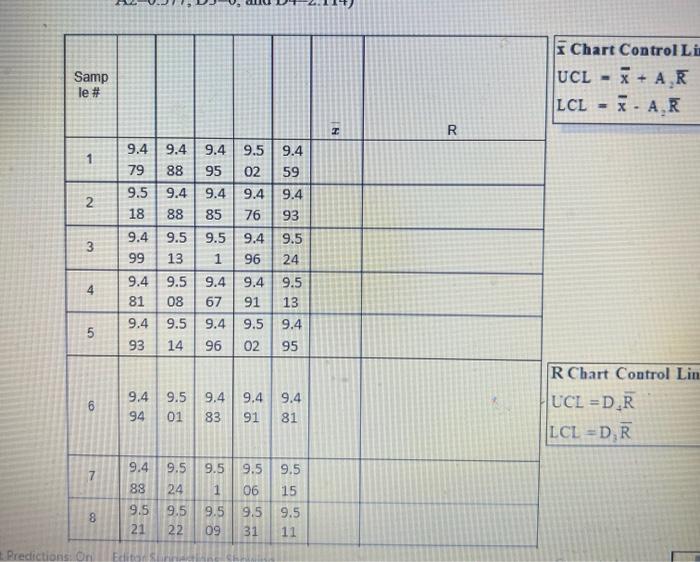
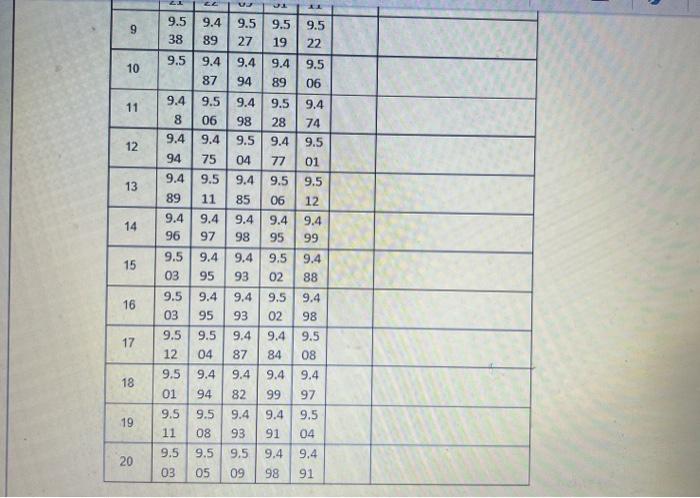
A process bas been monitored and sampled at periodic intervals over several days. Data have been collected in the table below. there are twenty samples each with a size of five observations. Find the control limits for x-bar and R charts using the equations discussed in class. Construct the appropriate control charts and analyze them to determine if the process appears to be in control or not.(15 pts) Suppose the specification for the process is 9.50.05, and =.01407, is the process capable? Justify your answer. (For n=5, A2=0.577,D3=0, and D4=2.114 ) UCL=x+A2RLCL=xA2R RChartControlLinLCL=D4RLCL=D3R
Step by Step Solution
There are 3 Steps involved in it
1 Expert Approved Answer
Step: 1 Unlock

Question Has Been Solved by an Expert!
Get step-by-step solutions from verified subject matter experts
Step: 2 Unlock
Step: 3 Unlock