

Question: 4 Advanced Physics The graph in figure 1 shows the range of audible intensities versus frequency. The human ear is most sensitive to frequencies near
4
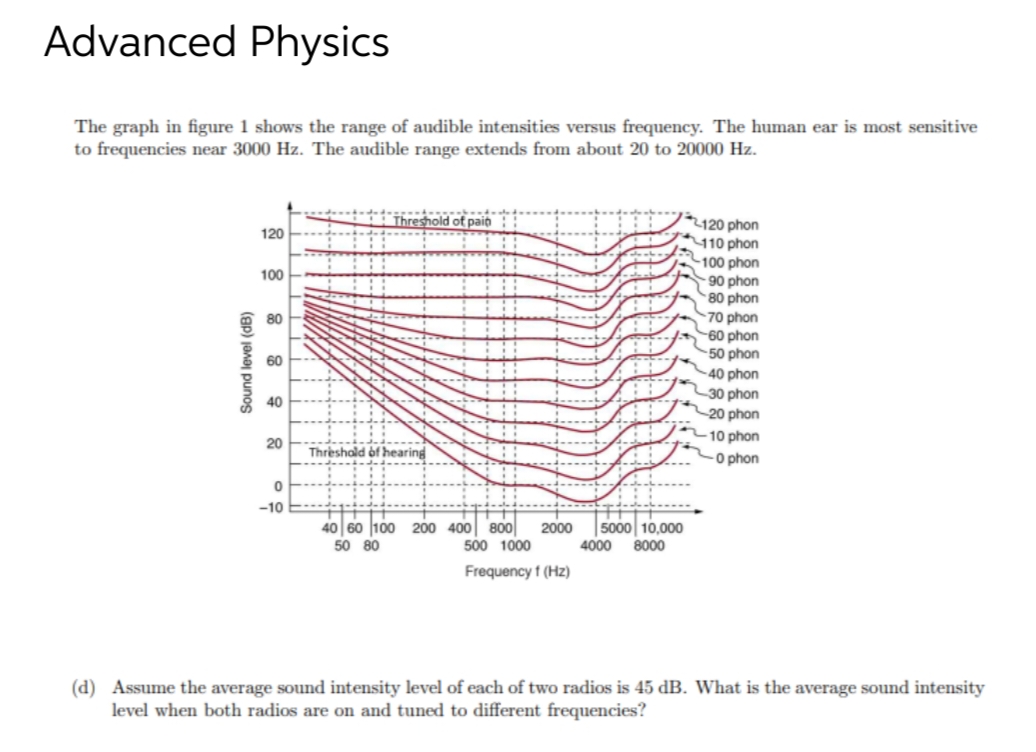
Advanced Physics The graph in figure 1 shows the range of audible intensities versus frequency. The human ear is most sensitive to frequencies near 3000 Hz. The audible range extends from about 20 to 20000 Hz. #2.120 phon 120 110 phon -100 phon 100 90 phon 80 phon 80 70 phon -60 phon -50 phon Sound level (dB) 60 40 phon 1 30 phon 40 #1 20 phon 10 phon 20 *0 phon -10 40 60 100 200 400 800 2000 5000 10,000 50 80 500 1000 4000 8000 Frequency f (Hz) (d) Assume the average sound intensity level of each of two radios is 45 dB. What is the average sound intensity level when both radios are on and tuned to different frequencies
Step by Step Solution
There are 3 Steps involved in it
1 Expert Approved Answer
Step: 1 Unlock

Question Has Been Solved by an Expert!
Get step-by-step solutions from verified subject matter experts
Step: 2 Unlock
Step: 3 Unlock