

Question: 4. An RLC (resistor-inductor-capacitor) circuit with an altenating current source is shown. (b) (Somewhat advanced) Look up the contour function in MATLAB. Make a plot
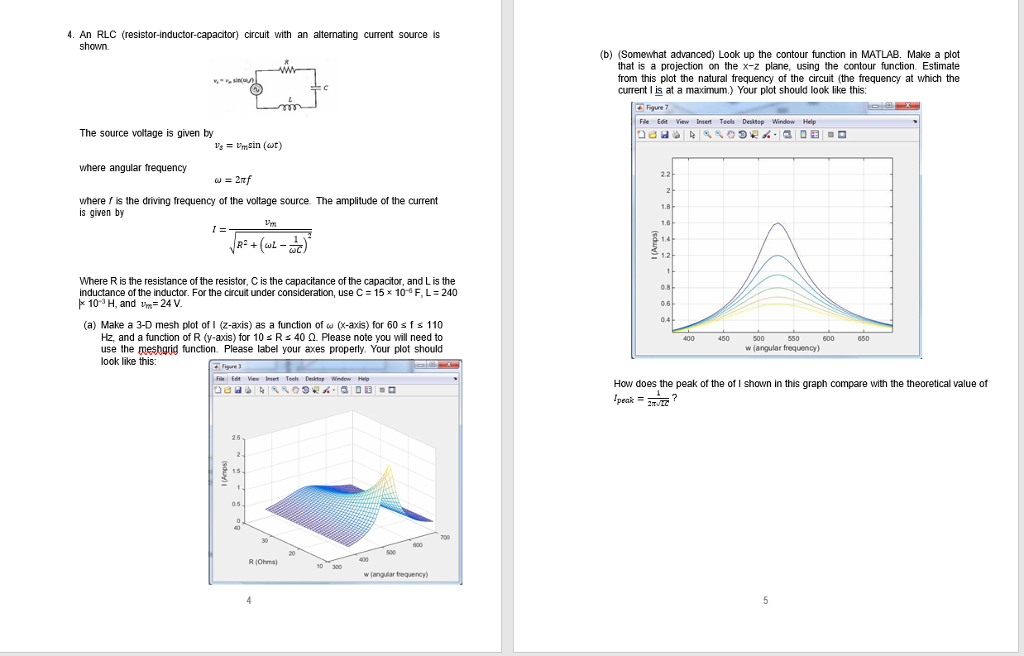
4. An RLC (resistor-inductor-capacitor) circuit with an altenating current source is shown. (b) (Somewhat advanced) Look up the contour function in MATLAB. Make a plot that is a projection on the x-z plane, using the contour function. Estimate from this plot the natural frequency of the circuit (the frequency at which the current I is at a maximum.) Your plot should look like this: Fle Edt View Insert Teels Desitsp Window Help The source voltage is given by where angular frequency 2.2 where f is the driving frequency of the voltage source. The amplitude of the current is given by Where R is the resistance of the resistor, C is the capacitance of the capacitor, and Lis the inductance of the inductor. For the circuit under consideration, use C = 15 10 F, L 240 10*H, and -24 V 0.8 0.4 (a) Make a 3-D mesh plot of 1 axis) as a function of (x-axis) for 60 s f s 110 Hz, and a function of R (y-axis) for 10R40 2. Please note you will need to use the mesharid function. Please label your axes properly. Your plot should w (angular frequency) look like this: How does the peak of the of i shown in this graph compare with the theoretical value of R (Ohms) w (angular frequency
Step by Step Solution
There are 3 Steps involved in it

Get step-by-step solutions from verified subject matter experts