

Question: 4. An x chart was created from process data of minutes spent on a specific task at a local factory. Use the chart to determine
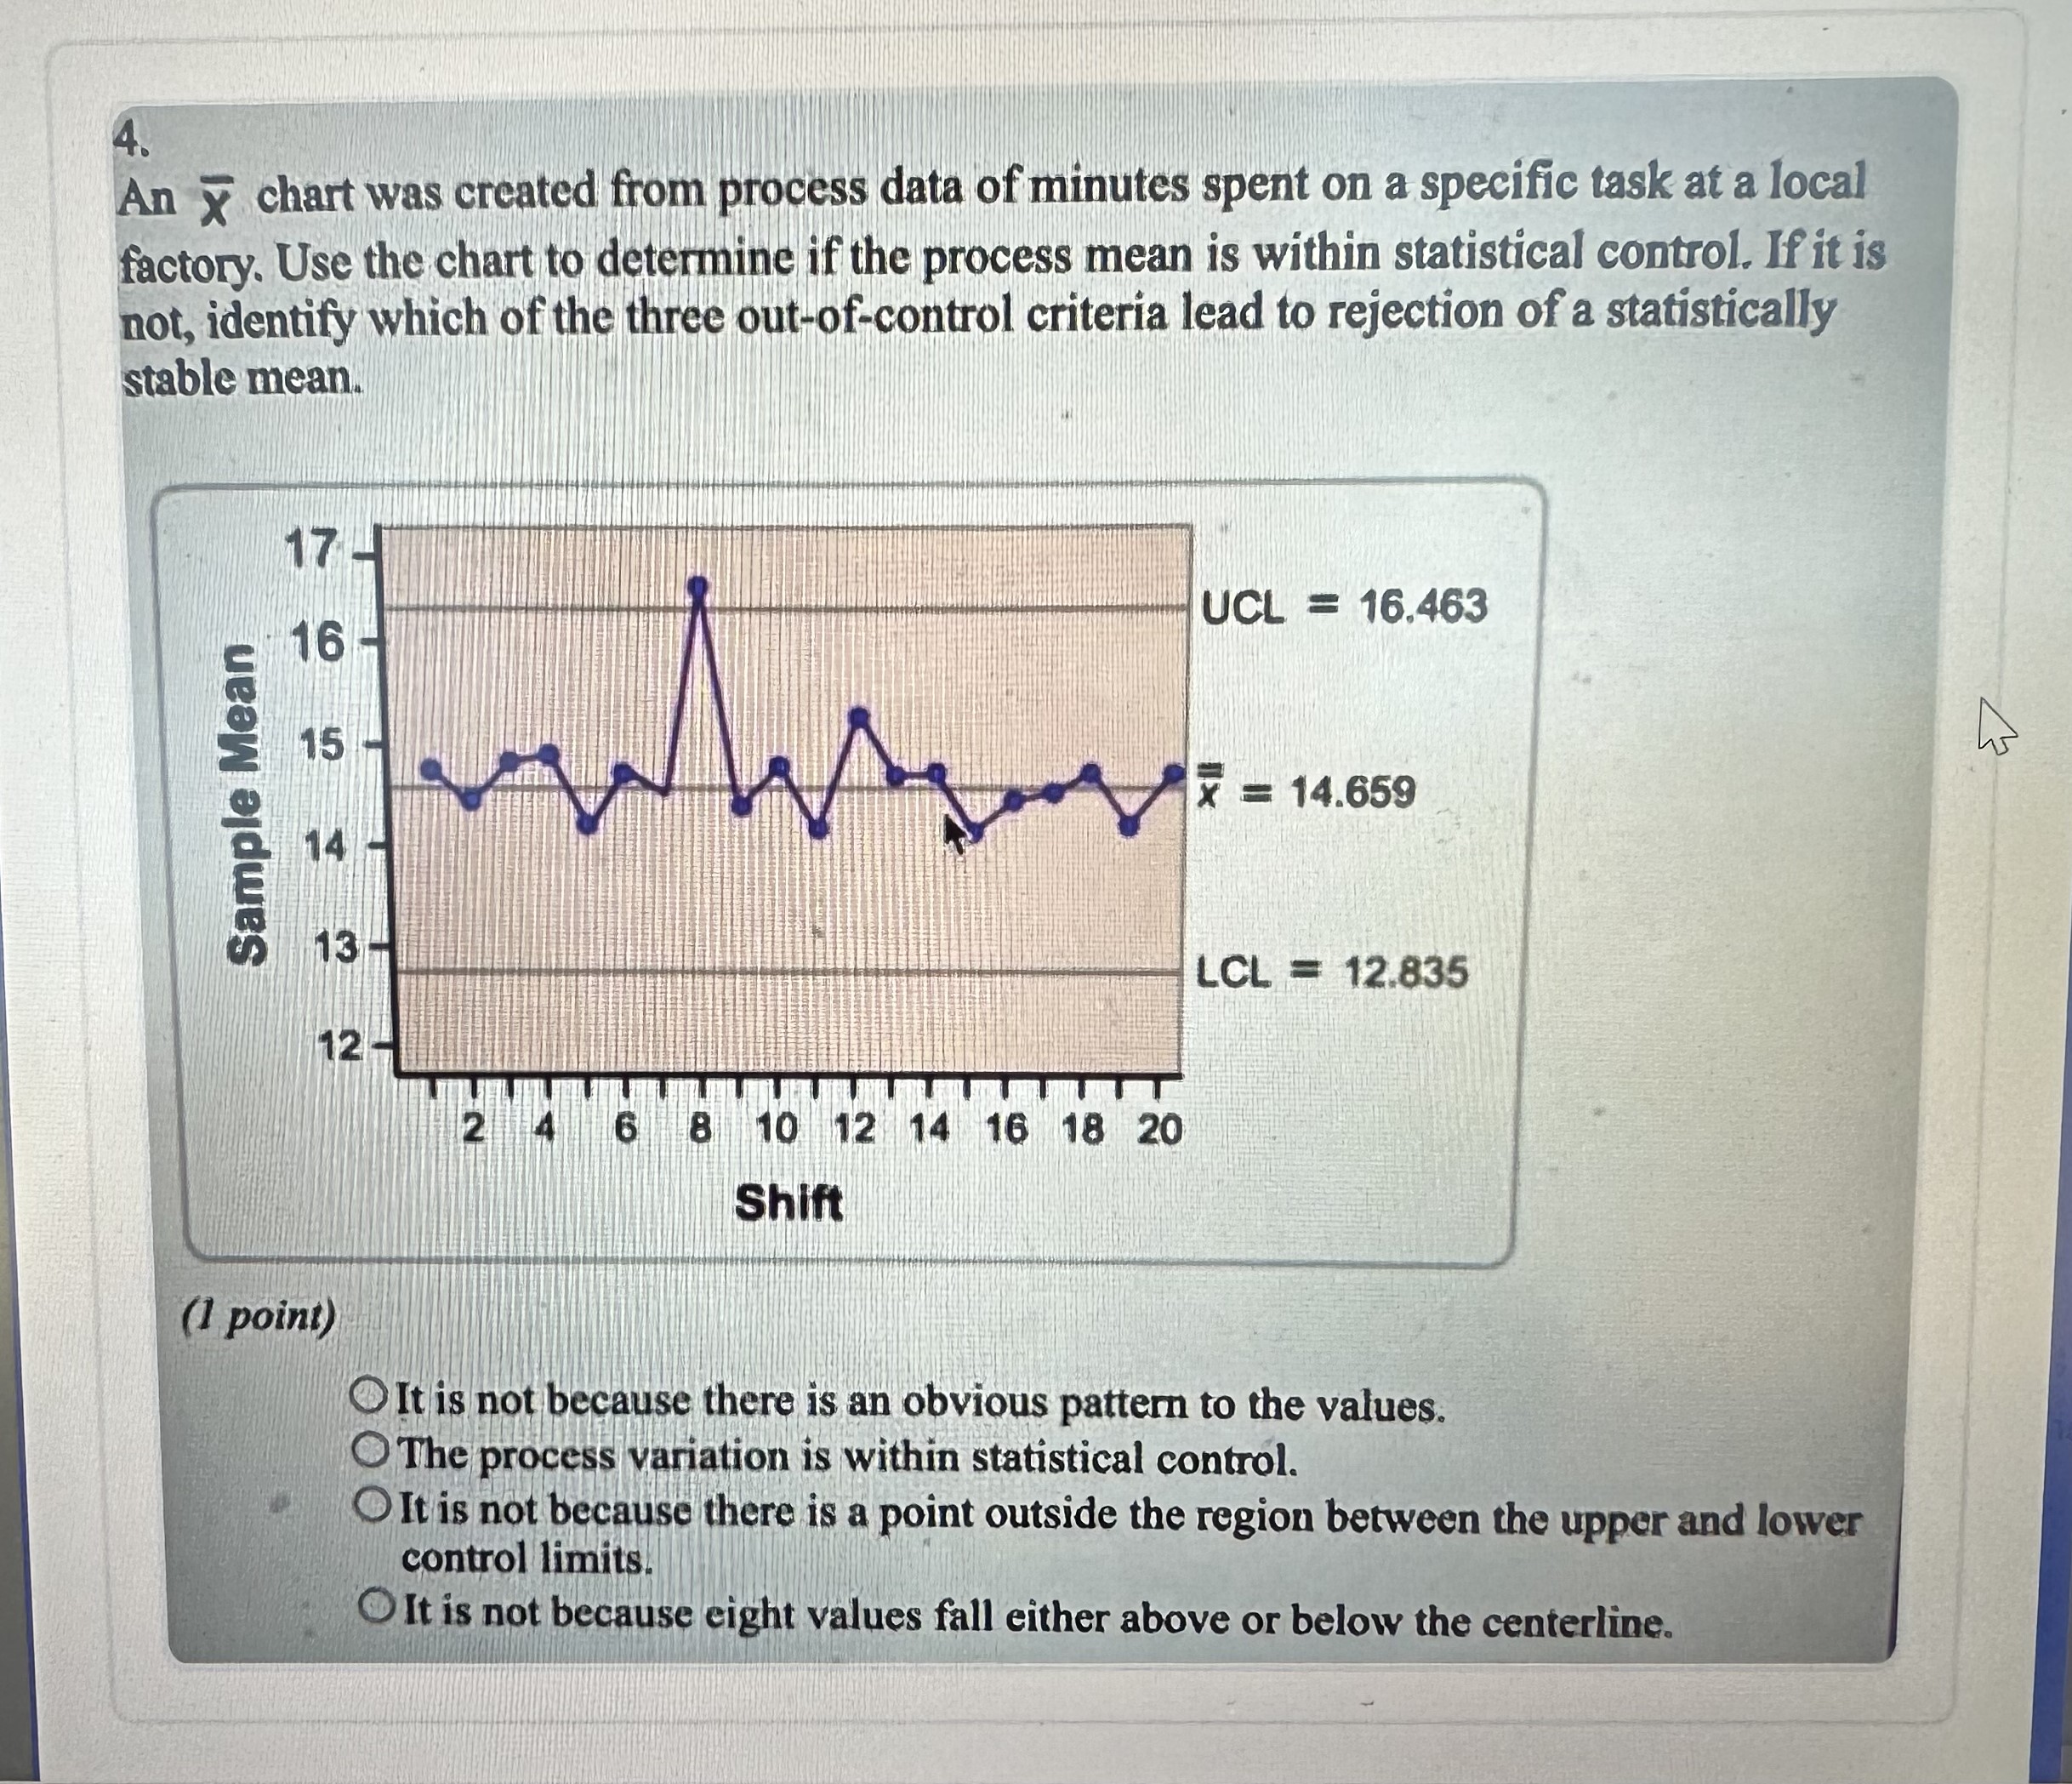
4. An x chart was created from process data of minutes spent on a specific task at a local factory. Use the chart to determine if the process mean is within statistical control. If it is not, identify which of the three out-of-control criteria lead to rejection of a statistically stable mean. 17 - UCL = 16.463 16 15 hs x = 14.659 Sample Mean 14 13 LCL = 12.835 12 8 10 12 14 16 18 20 Shift (1 point) It is not because there is an obvious pattern to the values. The process variation is within statistical control. It is not because there is a point outside the region between the upper and lower control limits. It is not because eight values fall either above or below the centerline
Step by Step Solution
There are 3 Steps involved in it

Get step-by-step solutions from verified subject matter experts