

Question: 4. The scatterplot below shows the number of hours spent studying for a physics test and the corresponding test grade for 20 students. 100 +
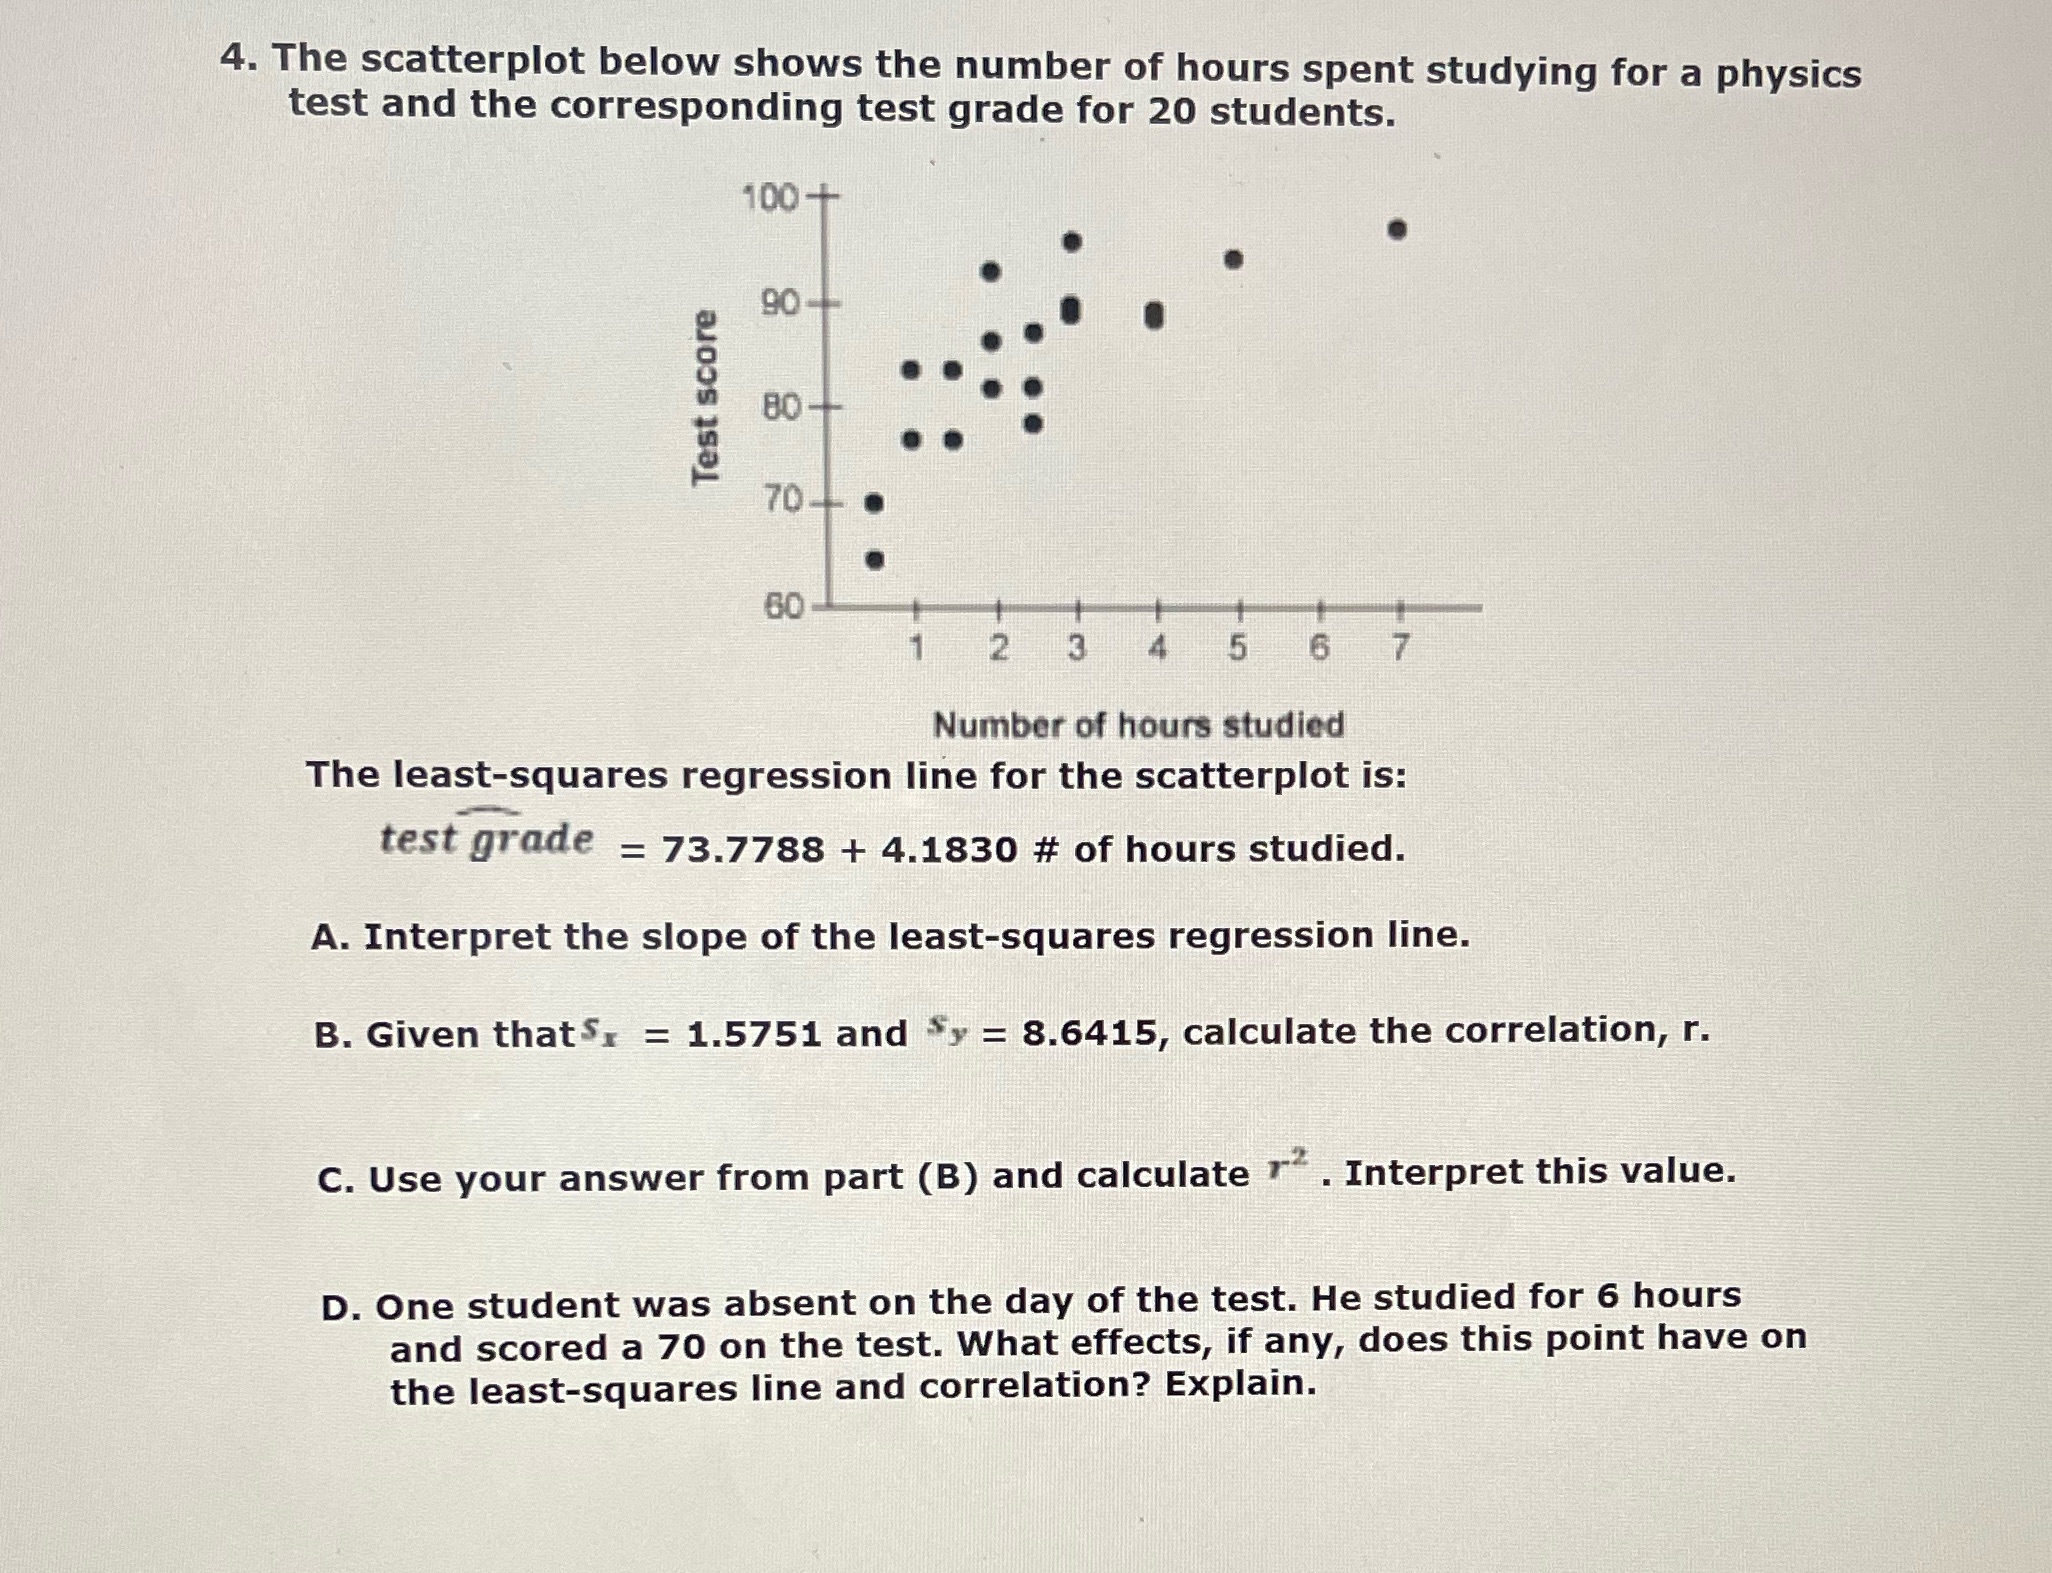
4. The scatterplot below shows the number of hours spent studying for a physics test and the corresponding test grade for 20 students. 100 + 90 Test score BC 70- 2 5 6 7 Number of hours studied The least-squares regression line for the scatterplot is: test grade = 73.7788 + 4.1830 # of hours studied. A. Interpret the slope of the least-squares regression line. B. Given thatS, = 1.5751 and $y = 8.6415, calculate the correlation, r. C. Use your answer from part (B) and calculate 7 . Interpret this value. D. One student was absent on the day of the test. He studied for 6 hours and scored a 70 on the test. What effects, if any, does this point have on the least-squares line and correlation? Explain
Step by Step Solution
There are 3 Steps involved in it

Get step-by-step solutions from verified subject matter experts