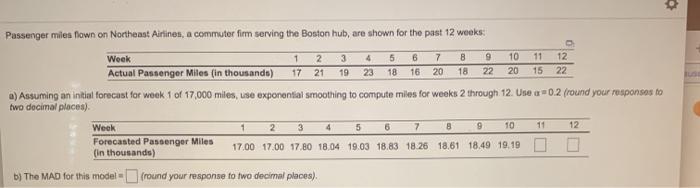
Question: . 4 B 3 19 5 18 6 16 7 20 9 22 10 20 12 22 18 Passenger miles flown on Northeast Airlines, a

. 4 B 3 19 5 18 6 16 7 20 9 22 10 20 12 22 18
. 4 B 3 19 5 18 6 16 7 20 9 22 10 20 12 22 18 Passenger miles flown on Northeast Airlines, a commuter firm serving the Boston hub, are shown for the past 12 weeks: Week 1 2 11 Actual Passenger Miles (in thousands) 17 21 23 15 a) Assuming an initial forecast for week 1 of 17,000 miles, use exponential smoothing to compute miles for weeks 2 through 12. Use a 0.2 (round your responses to two decimal places) Week 1 2 3 5 8 9 11 12 Forecasted Passenger Miles (in thousands) 17.00 17.00 17,80 18.04 19.03 18.83 18.26 18.61 18.49 19.190 b) The MAD for this model (round your response to two decimal places). 4 7 10 0.00 c) Compute the cumulativo forecast errors, cumulative MAD, and tracking signals (round your responses to two decimal places), Cumulative Cumulative Forecast Tracking Forecast Tracking Week Errors MAD Signal Week Errors MAD Signal 1 0.00 7 8.04 2.25 3.57 2 4.00 2.00 2.00 8 7.43 205 3.63 3 5.20 1.73 3.00 9 10.94 221 4.96 4 10.16 2.54 4.00 10 11.75 207 5.68 5 9.13 2.24 4.08 11 6 234 2.70 12 630 The controllimits for the tracking signal are set at 4MADs. The tracking signal acceptable limits

Step by Step Solution

There are 3 Steps involved in it

1 Expert Approved Answer
Step: 1 Unlock blur-text-image
Question Has Been Solved by an Expert!

Get step-by-step solutions from verified subject matter experts

Step: 2 Unlock
Step: 3 Unlock

Students Have Also Explored These Related General Management Questions!