

Question: 4 . b ) The annual maximum flood series for a gauging Station on the River Nore in Kilkenny from 2 0 0 6 to
b The annual maximum flood series for a gauging Station on the River Nore in
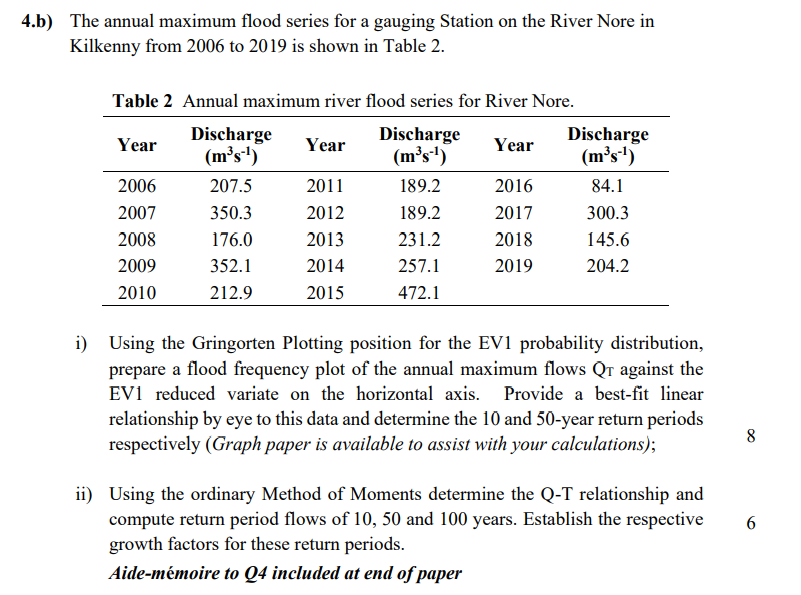
Kilkenny from to is shown in Table
Table Annual maximum river flood series for River Nore.
i Using the Gringorten Plotting position for the EV probability distribution,
prepare a flood frequency plot of the annual maximum flows against the
EV reduced variate on the horizontal axis. Provide a bestfit linear
relationship by eye to this data and determine the and year return periods
respectively Graph paper is available to assist with your calculations;
ii Using the ordinary Method of Moments determine the QT relationship and
compute return period flows of and years. Establish the respective
growth factors for these return periods.
Aidemmoire to Q included at end of paper where i is the index of the ranked annual maximum flow
series and N is the total number of annual maximum flows.
Reduced Variate
and
Step by Step Solution
There are 3 Steps involved in it
1 Expert Approved Answer
Step: 1 Unlock

Question Has Been Solved by an Expert!
Get step-by-step solutions from verified subject matter experts
Step: 2 Unlock
Step: 3 Unlock