

Question: 4. CAPM describes risk-return relation as a straight line in x-y plane (x for risk, measured by either beta or standard deviation; y for expected
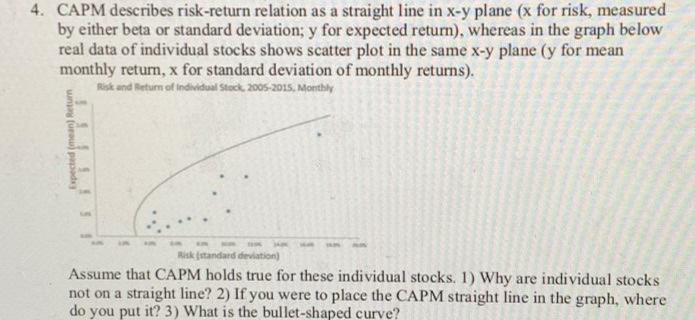
4. CAPM describes risk-return relation as a straight line in x-y plane (x for risk, measured by either beta or standard deviation; y for expected return), whereas in the graph below real data of individual stocks shows scatter plot in the same x-y plane (y for mean monthly return, x for standard deviation of monthly returns). Risk and Return of Indiedal Stock. 2005-2015. Monthly Retur a trsul ! Expected Risk standard deviation) Assume that CAPM holds true for these individual stocks. 1) Why are individual stocks not on a straight line? 2) If you were to place the CAPM straight line in the graph, where do you put it? 3) What is the bullet-shaped curve
Step by Step Solution
There are 3 Steps involved in it

Get step-by-step solutions from verified subject matter experts