

Question: 4) Compare the population mean average class size between schools where high school grade is required and schools where it is not required 5) Test
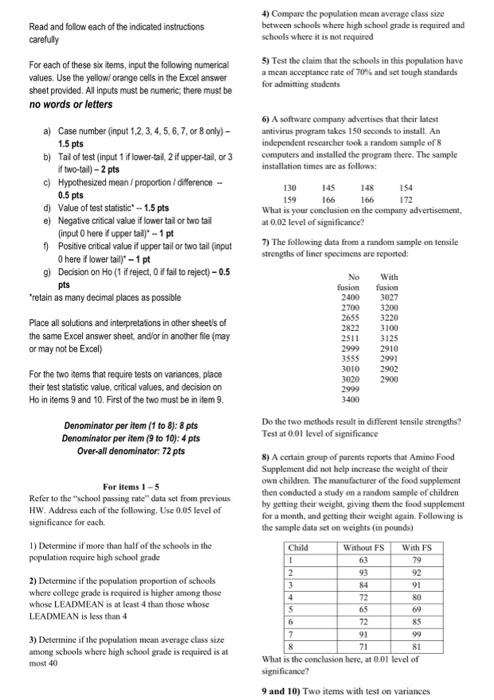
4) Compare the population mean average class size between schools where high school grade is required and schools where it is not required 5) Test the claim that the schools in this population have amcan acceptance rate of 70and set tough standards for admitting students 6) A software company advertises that their latest antivirus program takes 150 seconds to install. An independent researcher took a random sample of 8 computers and installed the program there. The sample installation times are as follows: 130 145 154 159 166 172 What is your conclusion on the company advertisement at 0.02 level of significance! 7) The following data from a random sample on tensile strengths of liner specimens are reported: 148 0.5 pts Read and follow each of the indicated instructions carefully For each of these six items, input the following numerical values. Use the yellow, orange cells in the Excel answer sheet provided. Al inputs must be numeric, there must be no words or letters a) Case number (input 1.2.3.4.5.6.7.0 8 only) - 1.5 pts b) Tal of test (input 1 iflower-tal, 2 it upper-tail, or 3 if two-tail) - 2 pts c) Hypothesized mean/proportion / difference - d Value of test statistic" - 1.5 pts e) Negative critical value if lower tail or two tail (input here it uppertal - 1 pt Positive critical value it upper tail or two tail (input O here flower taily - 1 pt 9) Decision on Ho (1 if reject , if fail to reject) - 0.5 pts *retain as many decimal places as possible Place all solutions and interpretations in other sheets of the same Excel answer sheet, andor in another file (may or may not be Excel) For the two items that require tests on variances, place their test statistic value critical values, and decision on Ho in items 9 and 10. First of the two must be in item 9. Denominator per item (1 to 8): 8 pts Denominator per item (9 to 10): 4 pts Over-all denominator 72 pts 166 No fusion 2400 2700 2655 2822 2511 2999 3355 3010 3020 2999 3400 With fusion 3027 3200 3220 3100 3125 2910 2991 2902 2900 For items 1-5 Refer to the school passing rate data set from previous HW. Address each of the following. Use 0.05 level of significance for each 1) Determine if more than half of the schools in the population require high school grade 2) Determine if the population proportion of schools where college grade is roquired is higher among those whose LEADMEAN is at least 4 than those whose LEADMEAN is less than 4 3) Determine if the population mean average class size among schools where high school grade is required is at Do the two methods result in different tensile strengths? Test at 0.01 level of significance 8) A certain group of parents reports that Amino Food Supplement did not help increase the weight of their own children. The manufacturer of the food supplement then conducted a study on a random sample of children by getting their weight, giving them the food supplement for a month, and getting their weight again. Following is the sample data set on weights (in pounds) Child Without FS With FS 1 63 79 2 93 3 84 91 4 72 80 5 65 69 6 72 85 7 91 90 71 81 What is the conclusion here, at 0.01 level of significance? 9 and 10) Two items with test on variances NINA most 40 4) Compare the population mean average class size between schools where high school grade is required and schools where it is not required 5) Test the claim that the schools in this population have amcan acceptance rate of 70and set tough standards for admitting students 6) A software company advertises that their latest antivirus program takes 150 seconds to install. An independent researcher took a random sample of 8 computers and installed the program there. The sample installation times are as follows: 130 145 154 159 166 172 What is your conclusion on the company advertisement at 0.02 level of significance! 7) The following data from a random sample on tensile strengths of liner specimens are reported: 148 0.5 pts Read and follow each of the indicated instructions carefully For each of these six items, input the following numerical values. Use the yellow, orange cells in the Excel answer sheet provided. Al inputs must be numeric, there must be no words or letters a) Case number (input 1.2.3.4.5.6.7.0 8 only) - 1.5 pts b) Tal of test (input 1 iflower-tal, 2 it upper-tail, or 3 if two-tail) - 2 pts c) Hypothesized mean/proportion / difference - d Value of test statistic" - 1.5 pts e) Negative critical value if lower tail or two tail (input here it uppertal - 1 pt Positive critical value it upper tail or two tail (input O here flower taily - 1 pt 9) Decision on Ho (1 if reject , if fail to reject) - 0.5 pts *retain as many decimal places as possible Place all solutions and interpretations in other sheets of the same Excel answer sheet, andor in another file (may or may not be Excel) For the two items that require tests on variances, place their test statistic value critical values, and decision on Ho in items 9 and 10. First of the two must be in item 9. Denominator per item (1 to 8): 8 pts Denominator per item (9 to 10): 4 pts Over-all denominator 72 pts 166 No fusion 2400 2700 2655 2822 2511 2999 3355 3010 3020 2999 3400 With fusion 3027 3200 3220 3100 3125 2910 2991 2902 2900 For items 1-5 Refer to the school passing rate data set from previous HW. Address each of the following. Use 0.05 level of significance for each 1) Determine if more than half of the schools in the population require high school grade 2) Determine if the population proportion of schools where college grade is roquired is higher among those whose LEADMEAN is at least 4 than those whose LEADMEAN is less than 4 3) Determine if the population mean average class size among schools where high school grade is required is at Do the two methods result in different tensile strengths? Test at 0.01 level of significance 8) A certain group of parents reports that Amino Food Supplement did not help increase the weight of their own children. The manufacturer of the food supplement then conducted a study on a random sample of children by getting their weight, giving them the food supplement for a month, and getting their weight again. Following is the sample data set on weights (in pounds) Child Without FS With FS 1 63 79 2 93 3 84 91 4 72 80 5 65 69 6 72 85 7 91 90 71 81 What is the conclusion here, at 0.01 level of significance? 9 and 10) Two items with test on variances NINA most 40
Step by Step Solution
There are 3 Steps involved in it

Get step-by-step solutions from verified subject matter experts