

Question: 4. Consider the following time series data Quarter Year 1 Year 2 Year 3 1 4 6 7 2 2 3 6 3 3 5
4. 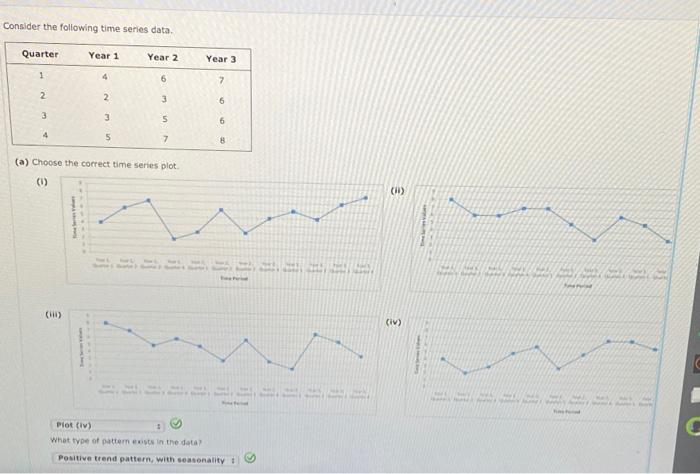
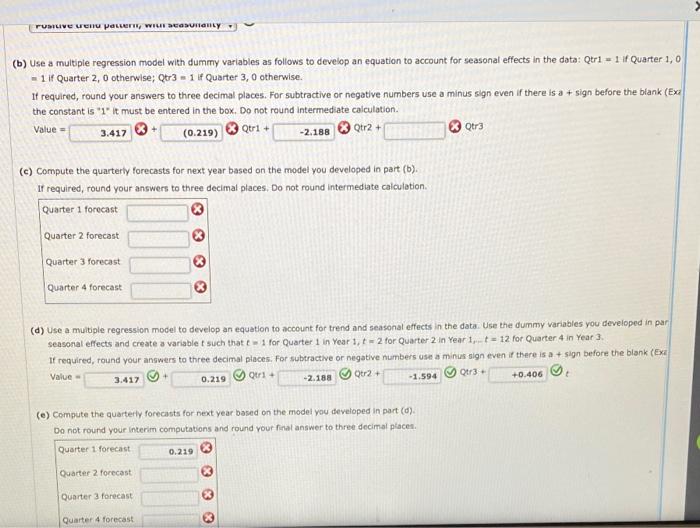
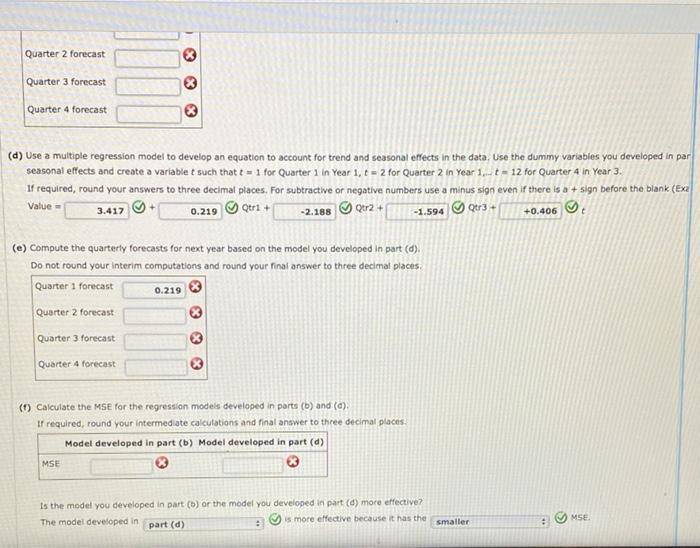
Consider the following time series data Quarter Year 1 Year 2 Year 3 1 4 6 7 2 2 3 6 3 3 5 5 4 5 7 8 (a) Choose the correct time series plot (1) (11) 1 (1) (iv) Piot (iv) 1 What type of pattern wists in the data Positive trend pattern with seasonality PUNILIVE Venu pacuern, WILL BEGUNGLY (b) Use a multiple regression model with dummy variables as follows to develop an equation to account for seasonal effects in the data: Qtri - 1 f Quarter 1,0 = 1 if Quarter 2,0 otherwise; Qt3 - 1 f Quarter 3,0 otherwise. If required, round your answers to three decimal places. For subtractive or negative numbers use a minus sign even if there is a + sign before the blank (Exa the constant is "1" it must be entered in the box. Do not round Intermediate calculation. 3.417 (0.219) Qui + -2.188 Qtr2+ Otr3 Value = (c) Compute the quarterly forecasts for next year based on the model you developed in part (b). It required, round your answers to three decimal places. Do not round intermediate calculation Quarter 1 forecast Quarter 2 forecast Quarter 3 forecast Quarter 4 forecast (d) Use a multiple regression model to develop an equation to account for trend and seasonal effects in the data. Use the dummy variables you developed in par seasonal effects and create a variable such that for Quarter 1 in Year 1,1-2 for Quarter 2 In Year 1-12 for Quarter 4 in Year 3 It required, round your answers to three decimal places. For subtractive or negative numbers use a minus sign even if there is a + sign before the blank (Exa Value - 3.417 0.219 Quri + -1.594 Qt3 +0.406 -2.183 002 (e) Compute the quarterly forecasts for next year based on the model you developed in part (0) Do not round your interim computations and round your final answer to three decimal places Quarter 1 forecast 0.219 Quarter 2 forecast Quarter 3 forecast 3 33 Quarter 4 forecast Quarter 2 forecast $ $ Quarter 3 forecast Quarter 4 forecast 83 (d) Use a multiple regression model to develop an equation to account for trend and seasonal effects in the data. Use the dummy variables you developed in par seasonal effects and create a variable t such that t = 1 for Quarter 1 In Year 1, t = 2 for Quarter 2 in Year 1. t= 12 for Quarter 4 in Year 3. If required, round your answers to three decimal places. For subtractive or negative numbers use a minus sign even if there is a + sign before the blank (Exi 0.219 Qtr1+ -2.188 Qur2+ 2013+ Value 3.417 -1.594 +0.406 (e) Compute the quarterly forecasts for next year based on the model you developed in part (d). Do not round your interim computations and round your final answer to three decimal places Quarter 1 forecast Quarter 2 forecast 0.219 Quarter 3 forecast Quarter 4 forecast (1) Calculate the MSE for the regression models developed in parts (b) and (c) If required, round your intermediate calculations and final answer to three decimal places Model developed in part (b) Model developed in part (d) MSE Is the model you developed in part (b) or the model you developed in part (d) more effective? The model developed in part (d) . is more effective because it has the MSE 9 smaller Step by Step Solution
There are 3 Steps involved in it
1 Expert Approved Answer
Step: 1 Unlock

Question Has Been Solved by an Expert!
Get step-by-step solutions from verified subject matter experts
Step: 2 Unlock
Step: 3 Unlock