

Question: 4. Do the following computations in the below excel Add a new tab in the sheet and Label it as 17 RRB COMP Sheet: (a)
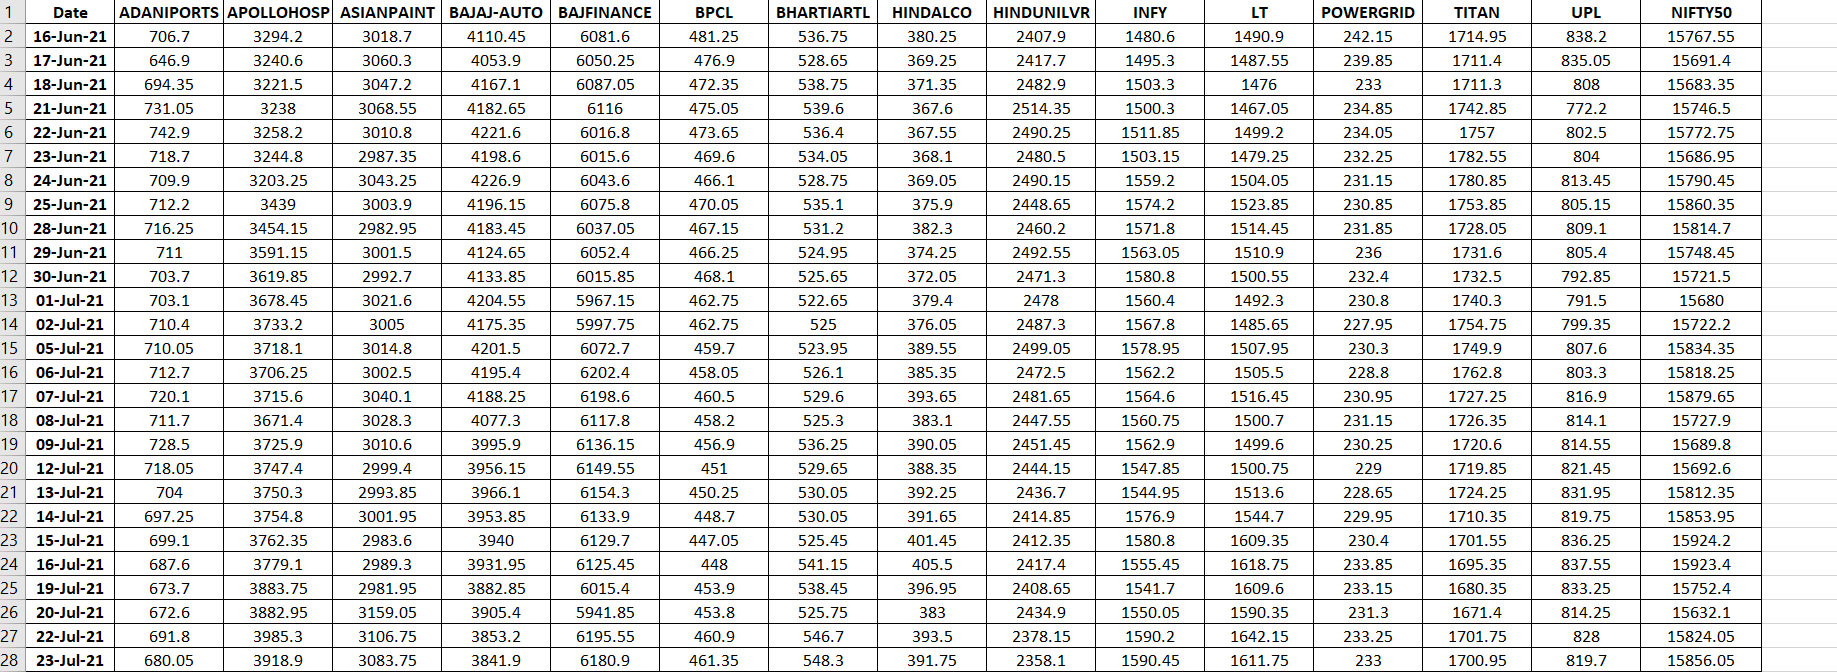
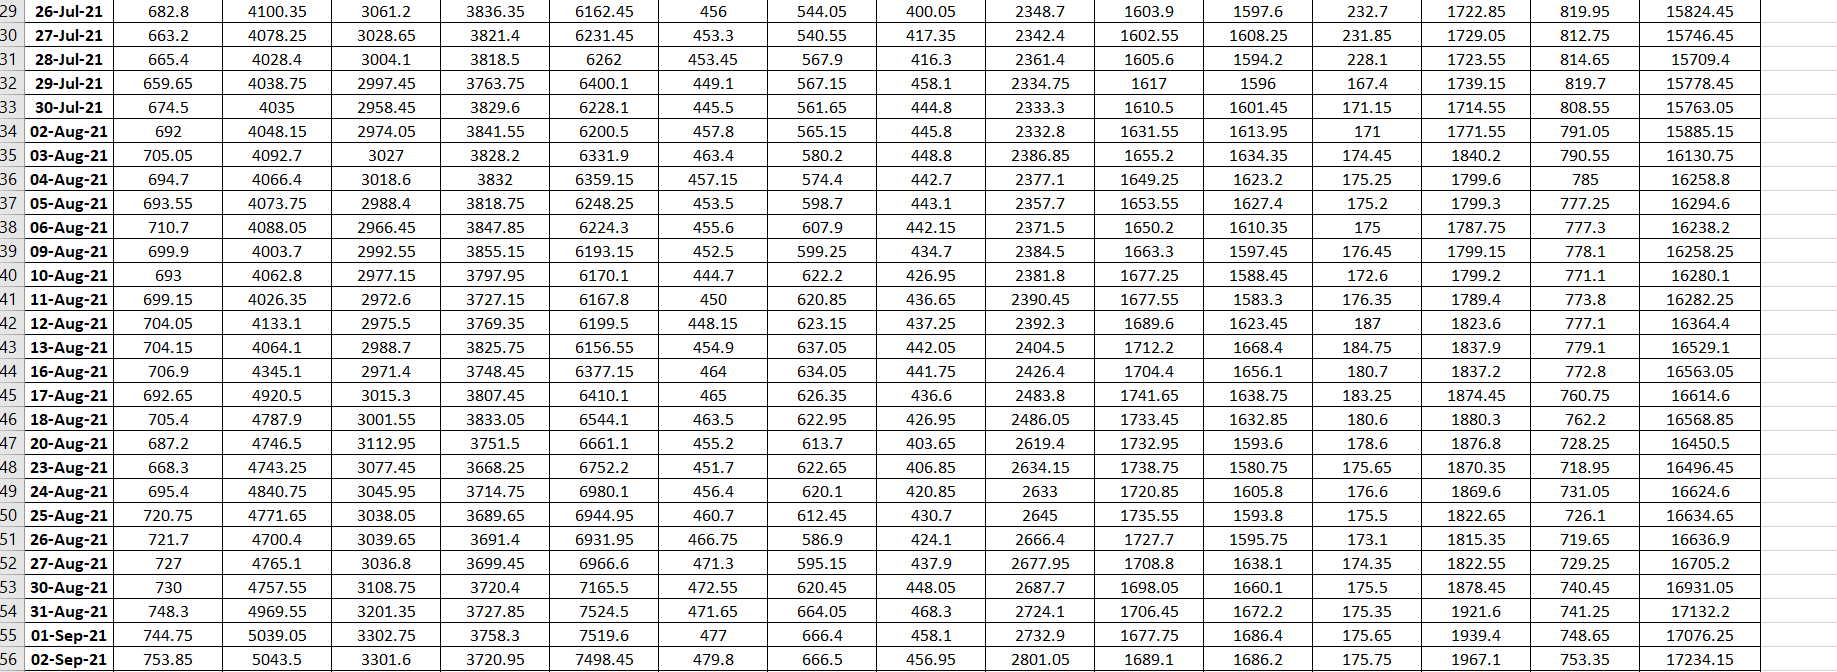
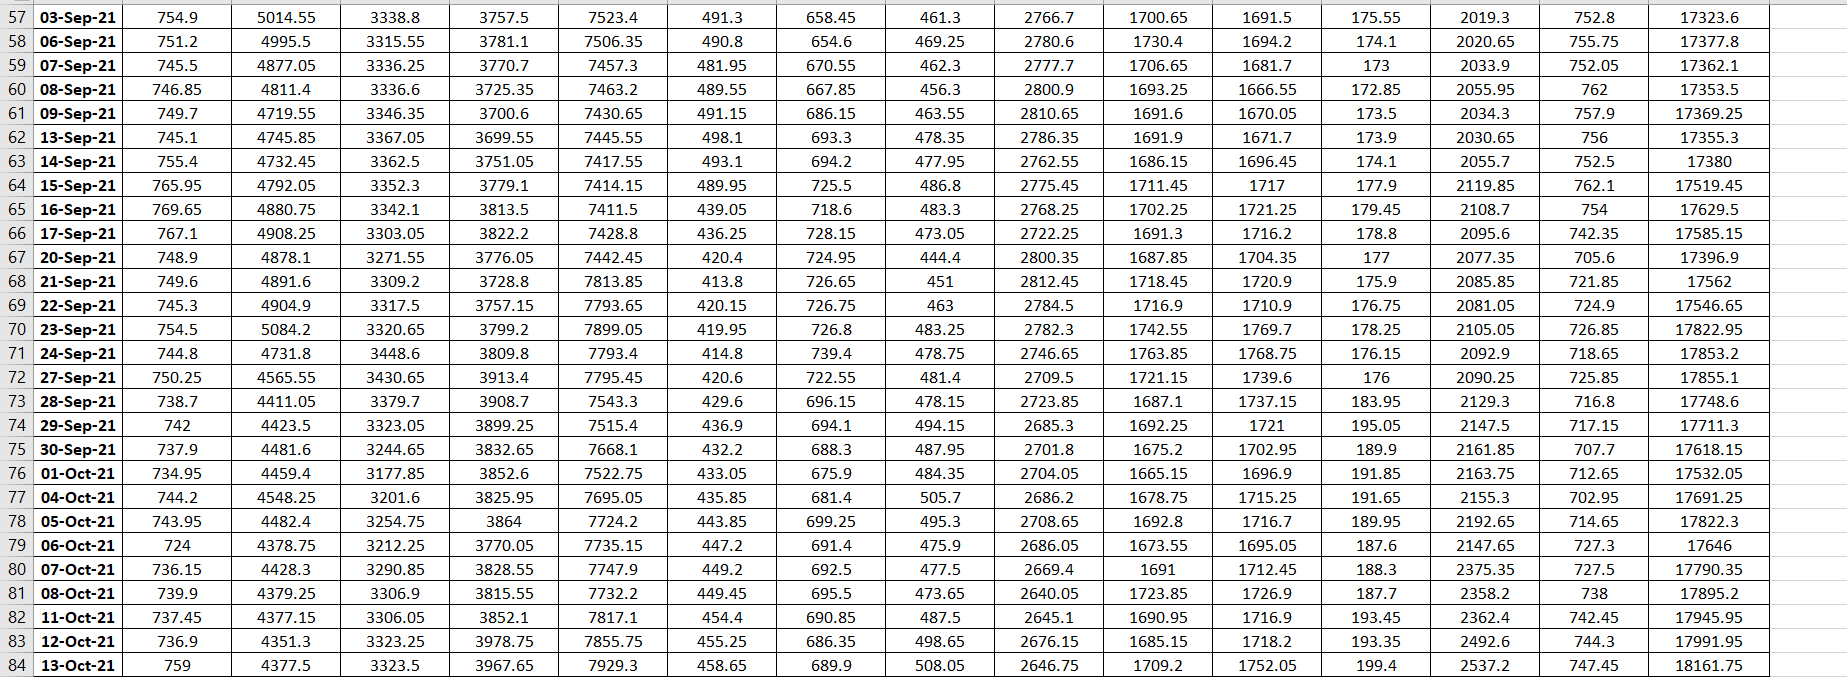
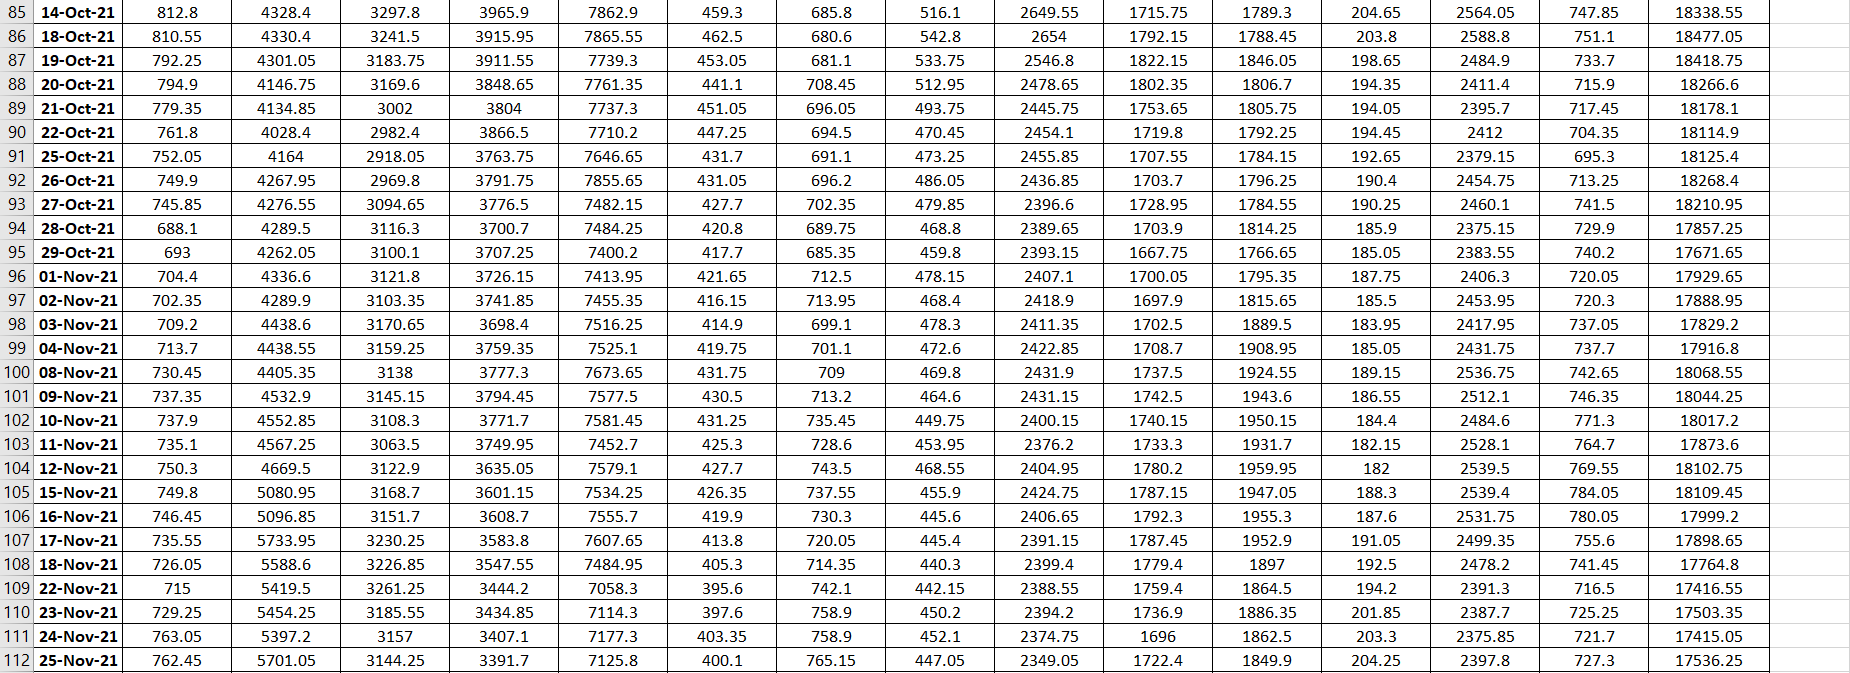
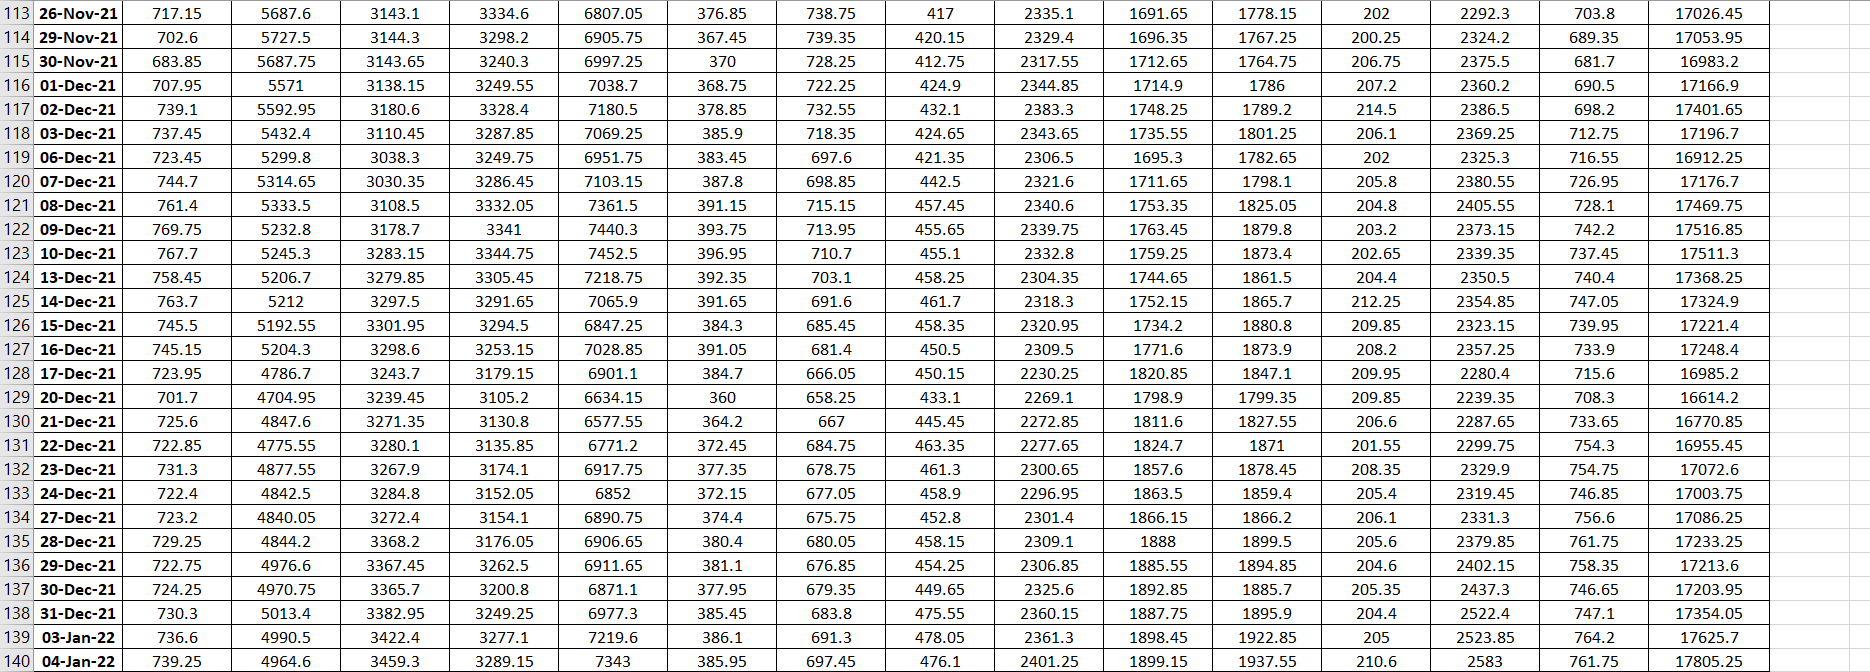
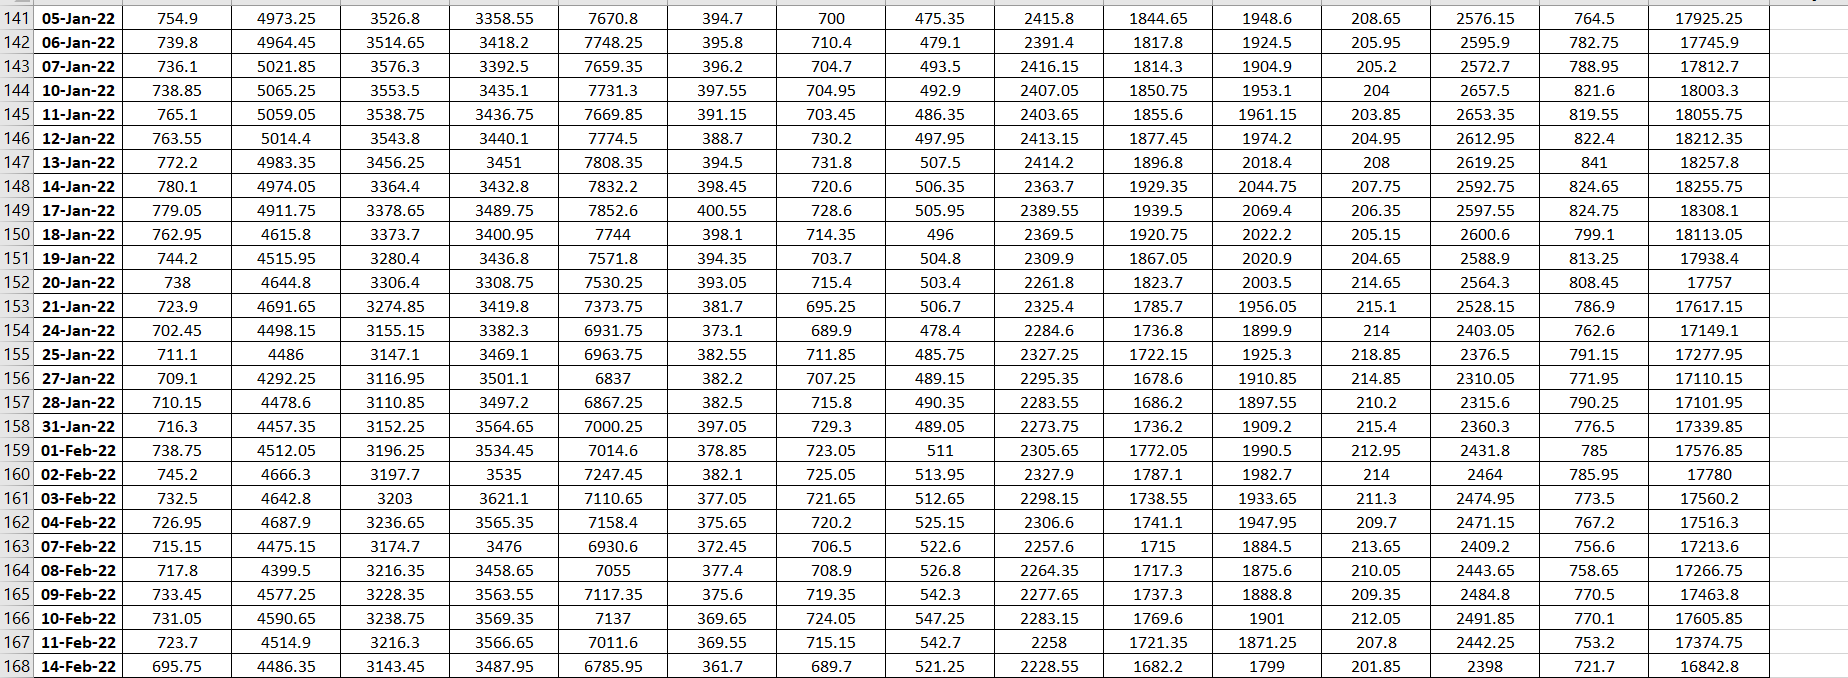
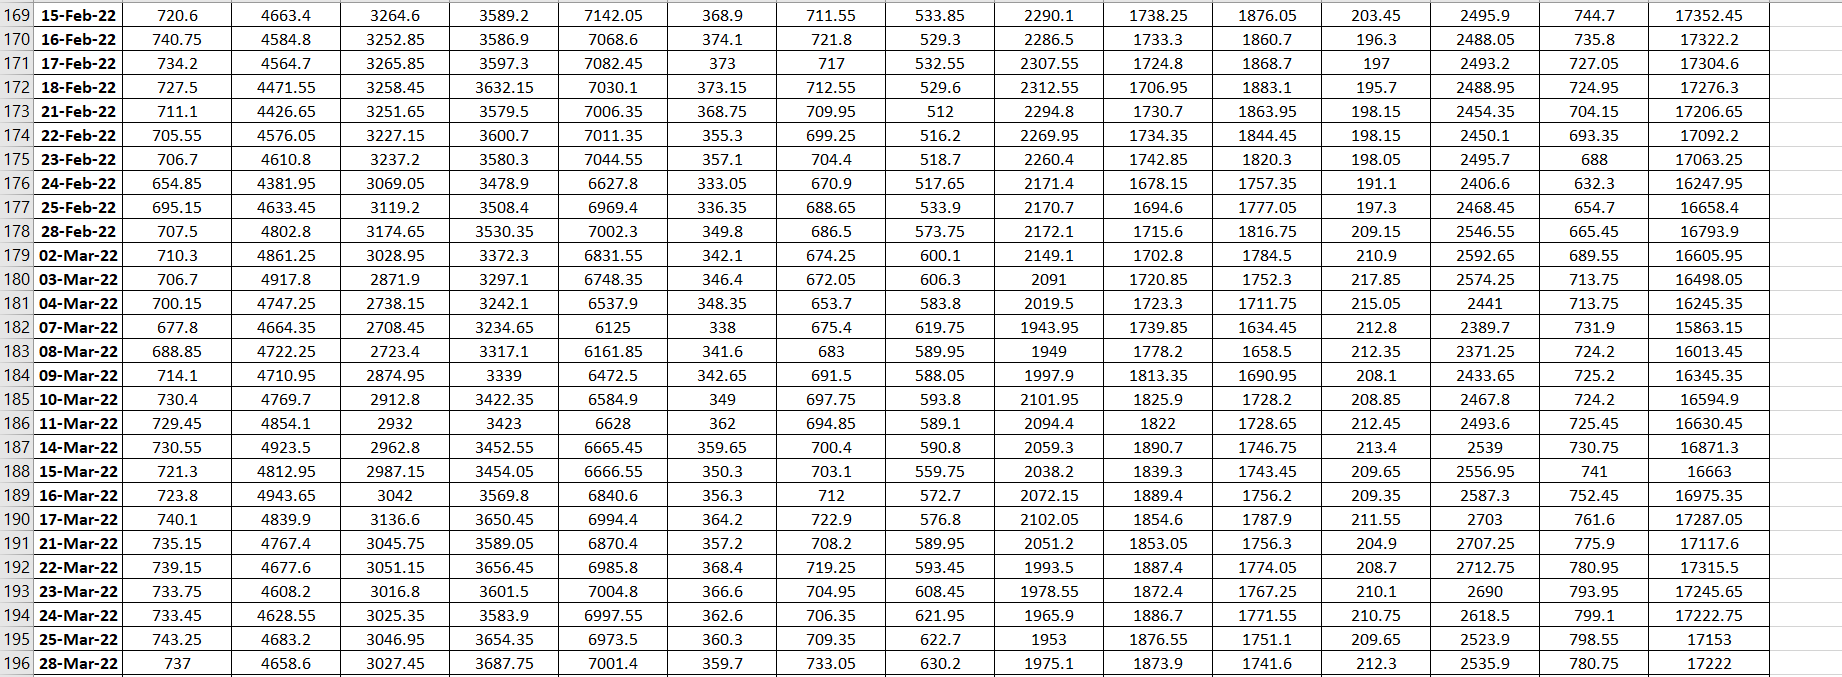
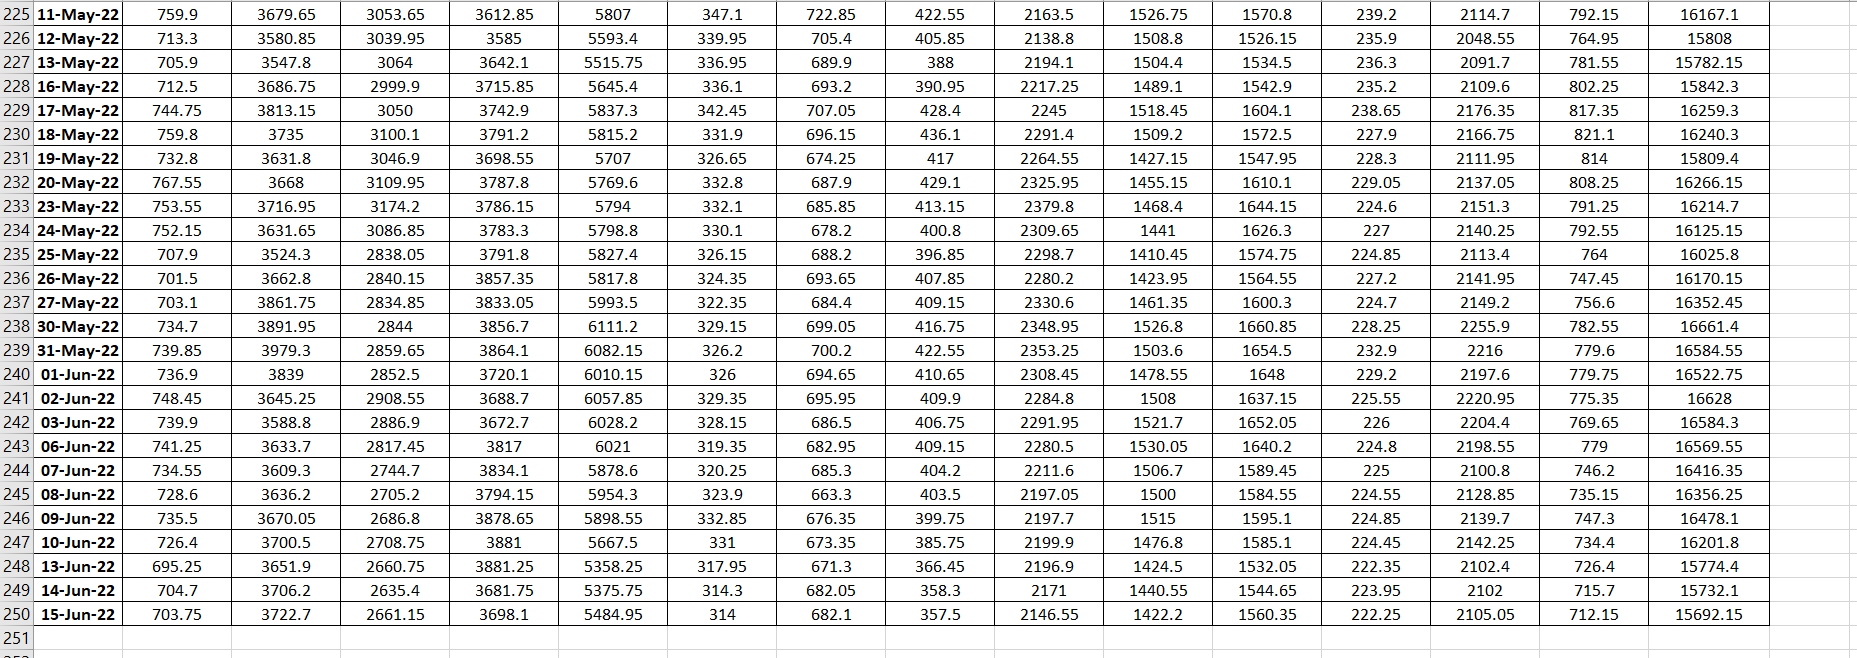
4. Do the following computations in the below excel Add a new tab in the sheet and Label it as 17 RRB COMP Sheet: (a) Risk-Return: Calculate for each one of the 14 individual stock and the NIFTY50 (These computations can be performed in the individual stock or NIFTY50 excel sheets): Expected Return (using log normal returns) and Risk (Look up your book / material / web for how to calculate them). (b) Compile all the 15 risks and returns (stocks and NIFTY50) data in a single table [TABLE 1] in 17 RRB COMP Sheet. Interpret the results in your own words. (c) Beta Computation: Calculate Beta of each of the individual 14 stocks w.r.t. the Market Index (NIFTY50) [The Beta of the reference market index is always taken as 1]. Tabulate the 14 Betas and sort them in decreasing order [TABLE 2]. Divide the list in two parts with first 7 as High Betas [TABLE 3] and next 7 as Low Betas [TABLE 4] and Comment on your results. All the 4 tables are put in 17 RRB COMP Sheet.
5. Beta Low & High Portfolio Analysis: (a) Beta-H Sheet and Beta-L Sheet: Next, Form two portfolios based on 7 high and 7 low beta stocks. Name them Portfolio Beta-H and Portfolio Beta-L. Adopt equal weightage (1/7) for computing the portfolio Risk and Return for Portfolio Beta-H and Portfolio Beta-L [Use Separate EXCEL Sheets for each Portfolio computation as 18 Port.B.H and 19 Port.B.L]. Compare the risk and return profiles of these two portfolios and state your interpretation. (b) Superior-P Sheet: Finally, answer, which of the two portfolios was found to be superior and Why? Use Sharpe Ratio and Rf = 7% for your answer. Show your Answer and working in Excel Sheet 20 Superior-P!
![in a single table [TABLE 1] in 17 RRB COMP Sheet. Interpret](https://dsd5zvtm8ll6.cloudfront.net/si.experts.images/questions/2024/09/66ee6f8e95756_15866ee6f8e1abd7.jpg)
Step by Step Solution
There are 3 Steps involved in it

Get step-by-step solutions from verified subject matter experts