

Question: 4. Examine Figures 3a (scatterplot) and 3b (Bland-Altman plot) below and briefly comment on the extent to which the two displacement densiometric methodologies (BODPOD and

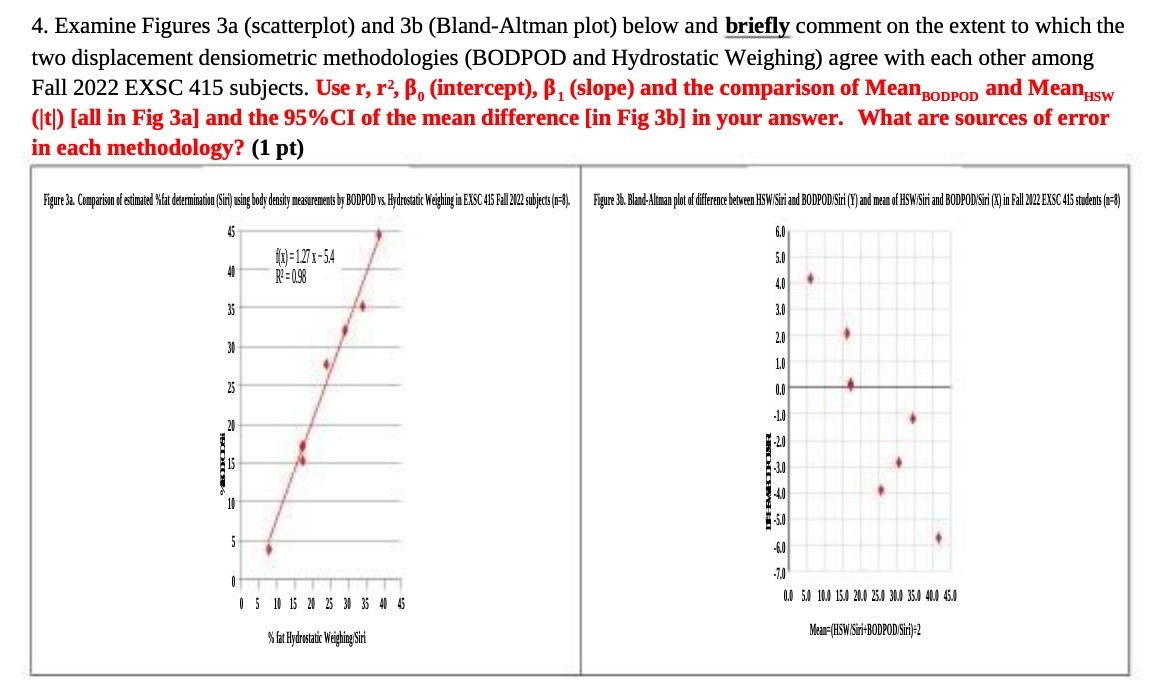
4. Examine Figures 3a (scatterplot) and 3b (Bland-Altman plot) below and briefly comment on the extent to which the two displacement densiometric methodologies (BODPOD and Hydrostatic Weighing) agree with each other among Fall 2022 EXSC 415 subjects. Use r, r2, B, (intercept), B, (slope) and the comparison of MeanBODPOD and MeanHaw (It)) [all in Fig 3a] and the 95%CI of the mean difference [in Fig 3b] in your answer. What are sources of error in each methodology? (1 pt) Figure 32. Comparison of estimated %fat determination (Siri) using body density measurements by BODPOD vs. Hydrostatic Weighing in EXSC 415 Fall 2122 subjects (n=8). Figure 36. Bland- Altman plot of difference between HSW/Siri and BODPOD/Siri (Y) and mean of HSW/Siri and BODPOD Siri (X) in Fall 2022 EXSC 415 students (@=8) 45 (x)=127 x-5.4 5.0 R' = 0.98 S 0 5 10 15 20 25 30 35 40 45 0.0 5.0 10.0 15.0 20.0 25.0 30.0 35.0 40.0 45.0 % fat Hydrostatic Weighing Siri Mean=(HSW/Siri+BODPOD/Siri)=2
Step by Step Solution
There are 3 Steps involved in it

Get step-by-step solutions from verified subject matter experts