

Question: 4 Figure 7.10 shows the flux through a loop as a function of time. a Sketch the rate of change of flux through the
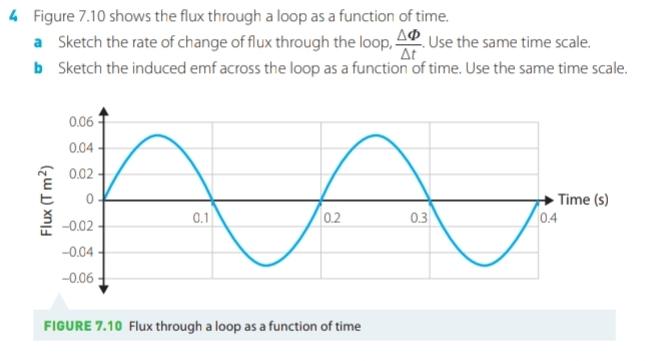
4 Figure 7.10 shows the flux through a loop as a function of time. a Sketch the rate of change of flux through the loop, A Use the same time scale. At b Sketch the induced emf across the loop as a function of time. Use the same time scale. Flux (T m) 0.06 0.04 0.02 0 -0.02 -0.04 -0.06 A 0.2 0.3 0.1 FIGURE 7.10 Flux through a loop as a function of time Time (s) 0.4
Step by Step Solution
There are 3 Steps involved in it
1 Expert Approved Answer
Step: 1 Unlock

Question Has Been Solved by an Expert!
Get step-by-step solutions from verified subject matter experts
Step: 2 Unlock
Step: 3 Unlock