

Question: 4. Financial Statement Analysis interpretation: 13 marks The following table provides an historical summary of key financial ratios for Hallenstein Glassons Limited (HGL). HGL is
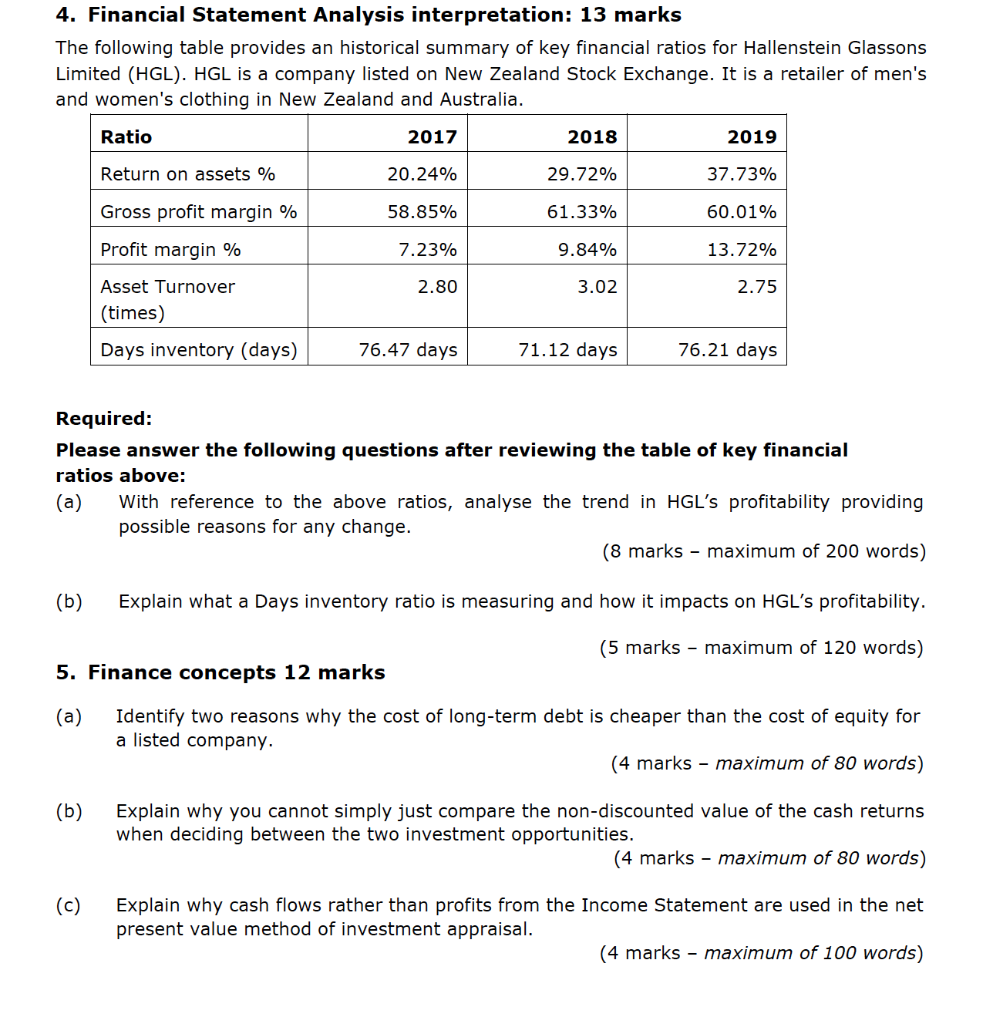
4. Financial Statement Analysis interpretation: 13 marks The following table provides an historical summary of key financial ratios for Hallenstein Glassons Limited (HGL). HGL is a company listed on New Zealand Stock Exchange. It is a retailer of men's and women's clothing in New Zealand and Australia. Ratio 2017 2018 2019 Return on assets % 20.24% 29.72% 37.73% Gross profit margin % 58.85% 61.33% 60.01% Profit margin % 7.23% 9.84% 13.72% 2.80 3.02 2.75 Asset Turnover (times) Days inventory (days) 76.47 days 71.12 days 76.21 days Required: Please answer the following questions after reviewing the table of key financial ratios above: (a) With reference to the above ratios, analyse the trend in HGL's profitability providing possible reasons for any change. (8 marks - maximum of 200 words) (b) Explain what a Days inventory ratio is measuring and how it impacts on HGL's profitability. (5 marks - maximum of 120 words) 5. Finance concepts 12 marks (a) Identify two reasons why the cost of long-term debt is cheaper than the cost of equity for a listed company. (4 marks - maximum of 80 words) (b) Explain why you cannot simply just compare the non-discounted value of the cash returns when deciding between the two investment opportunities. (4 marks - maximum of 80 words) (c) Explain why cash flows rather than profits from the Income Statement are used in the net present value method of investment appraisal. (4 marks - maximum of 100 words)
Step by Step Solution
There are 3 Steps involved in it

Get step-by-step solutions from verified subject matter experts