

Question: 4. Find the interquartile range and the upper and lower boundaries for outliers. Given: Q1 = 50, Q2= 72, Q3 = 110, and Q4 =
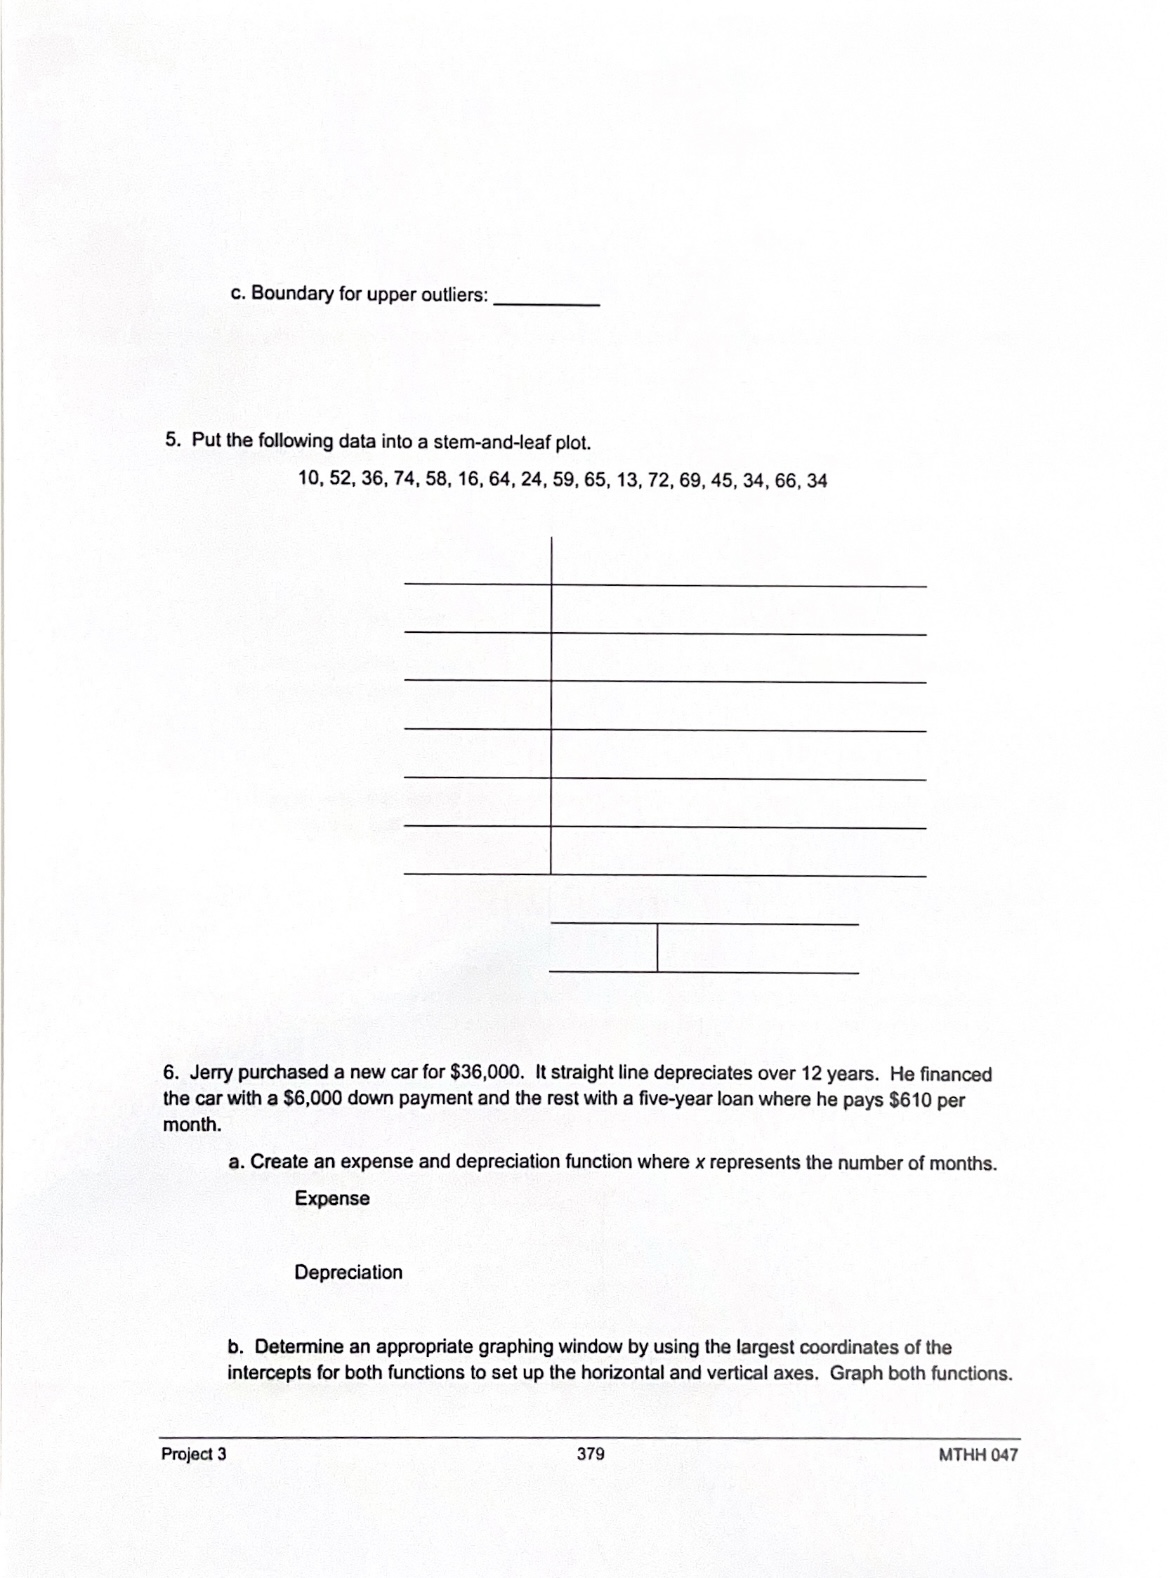
4. Find the interquartile range and the upper and lower boundaries for outliers. Given: Q1 = 50, Q2= 72, Q3 = 110, and Q4 = 150 a. Interquartile range: b. Boundary for lower outliers: Project 3 378 MTHH 047c. Boundary for upper outliers: 5. Put the following data into a stern-and-teaf plot. 10. 52. 36. 74. 58. 16. 64. 24. 59. 65. 13, 72. 69. 45. 34. 66. 34 :i: 6. Jerry purchased a new car for 336.000. It straight line depreciates over 12 years. He nanced the car with a 56,000 down payment and the rest with a live-year loan where he pays $610 per month. 8. Create an expense and depreciation function where x represents the number of months. Expense Depreciation ti. Determine an appropriate graphing window by using the largest coordinates of the intercepts for both functions to set up the horizontal and vertical axes. Graph both functions. Project 3 379 MTHH m7 c. Using a graphing calculator, find the coordinates of the intersection point. Explain what the intersection point represents. d. Explain what the regions both before and after the intersection points represent. Make sure to mention both
Step by Step Solution
There are 3 Steps involved in it

Get step-by-step solutions from verified subject matter experts