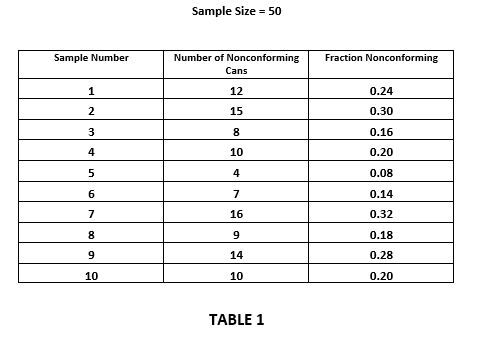
Question: 4. For the data shown in Table 1, determine: a. Center line for fraction nonconforming control chart. b. UCL and LCL for the fraction nonconforming

4. For the data shown in Table 1, determine: a.4. For the data shown in Table 1, determine: a.

4. For the data shown in Table 1, determine: a. Center line for fraction nonconforming control chart. b. UCL and LCL for the fraction nonconforming control chart C. Construct this control chart Sample Size = 50 Sample Number Fraction Nonconforming Number of Nonconforming Cans 0.24 0.30 0.16 0.20 0.08 0.14 0.32 0.18 0.28 10 0.20 TABLE 1

Step by Step Solution

There are 3 Steps involved in it

1 Expert Approved Answer
Step: 1 Unlock blur-text-image
Question Has Been Solved by an Expert!

Get step-by-step solutions from verified subject matter experts

Step: 2 Unlock
Step: 3 Unlock

Students Have Also Explored These Related General Management Questions!