

Question: 4. For the following data plot on regular, semi-log and log-log graph paper until you get a straight line. Determine the equation of this
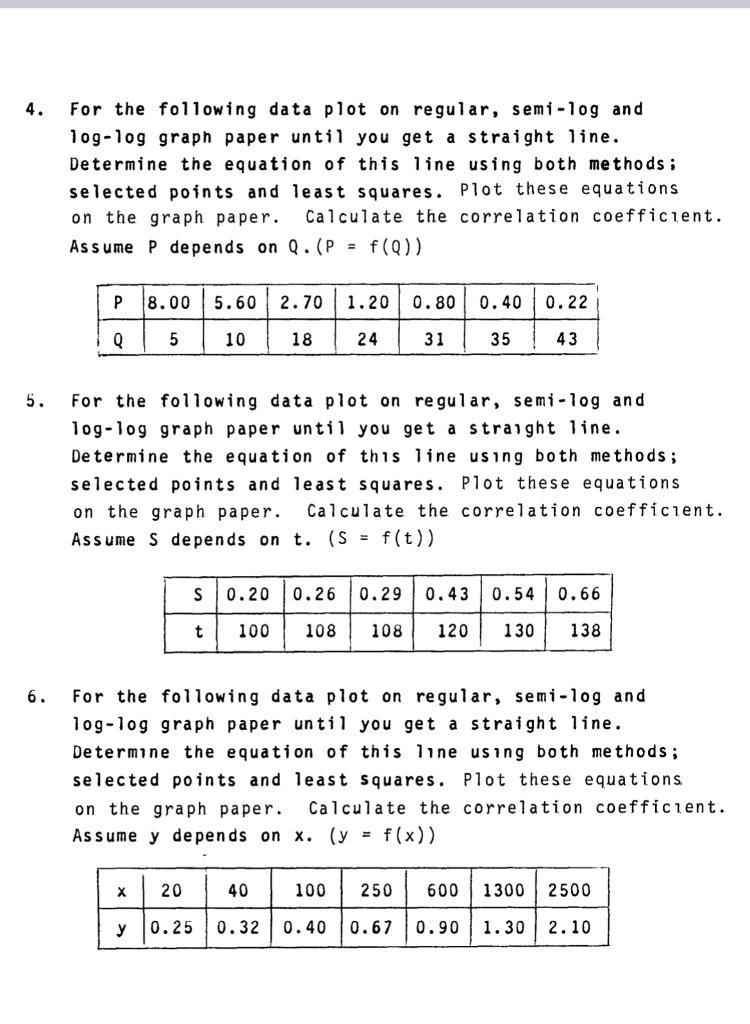
4. For the following data plot on regular, semi-log and log-log graph paper until you get a straight line. Determine the equation of this line using both methods; selected points and least squares. Plot these equations on the graph paper. Calculate the correlation coefficient. Assume P depends on Q. (P = f(Q)) 8.00 5.60 2.70 1.20 0.80 0.40 0.22 P Q 5 10 18 24 31 35 43 5. For the following data plot on regular, semi-log and log-log graph paper until you get a straight line. Determine the equation of this line using both methods; selected points and least squares. Plot these equations on the graph paper. Calculate the correlation coefficient. Assume S depends on t. (S = f(t)) S 0.20 0.26 0.29 0.43 0.54 0.66 t 100 108 108 120 130 138 6. For the following data plot on regular, semi-log and log-log graph paper until you get a straight line. Determine the equation of this line using both methods; selected points and least squares. Plot these equations on the graph paper. Calculate the correlation coefficient. Assume y depends on x. (y = f(x)) X 20 40 100 250 600 1300 2500 y 0.25 0.32 0.40 0.67 0.90 1.30 2.10
Step by Step Solution
There are 3 Steps involved in it

Get step-by-step solutions from verified subject matter experts