

Question: 4. Given that 1 13 out of a random sample of 310 adults indicated that they support the practice of changing clocks twice a year
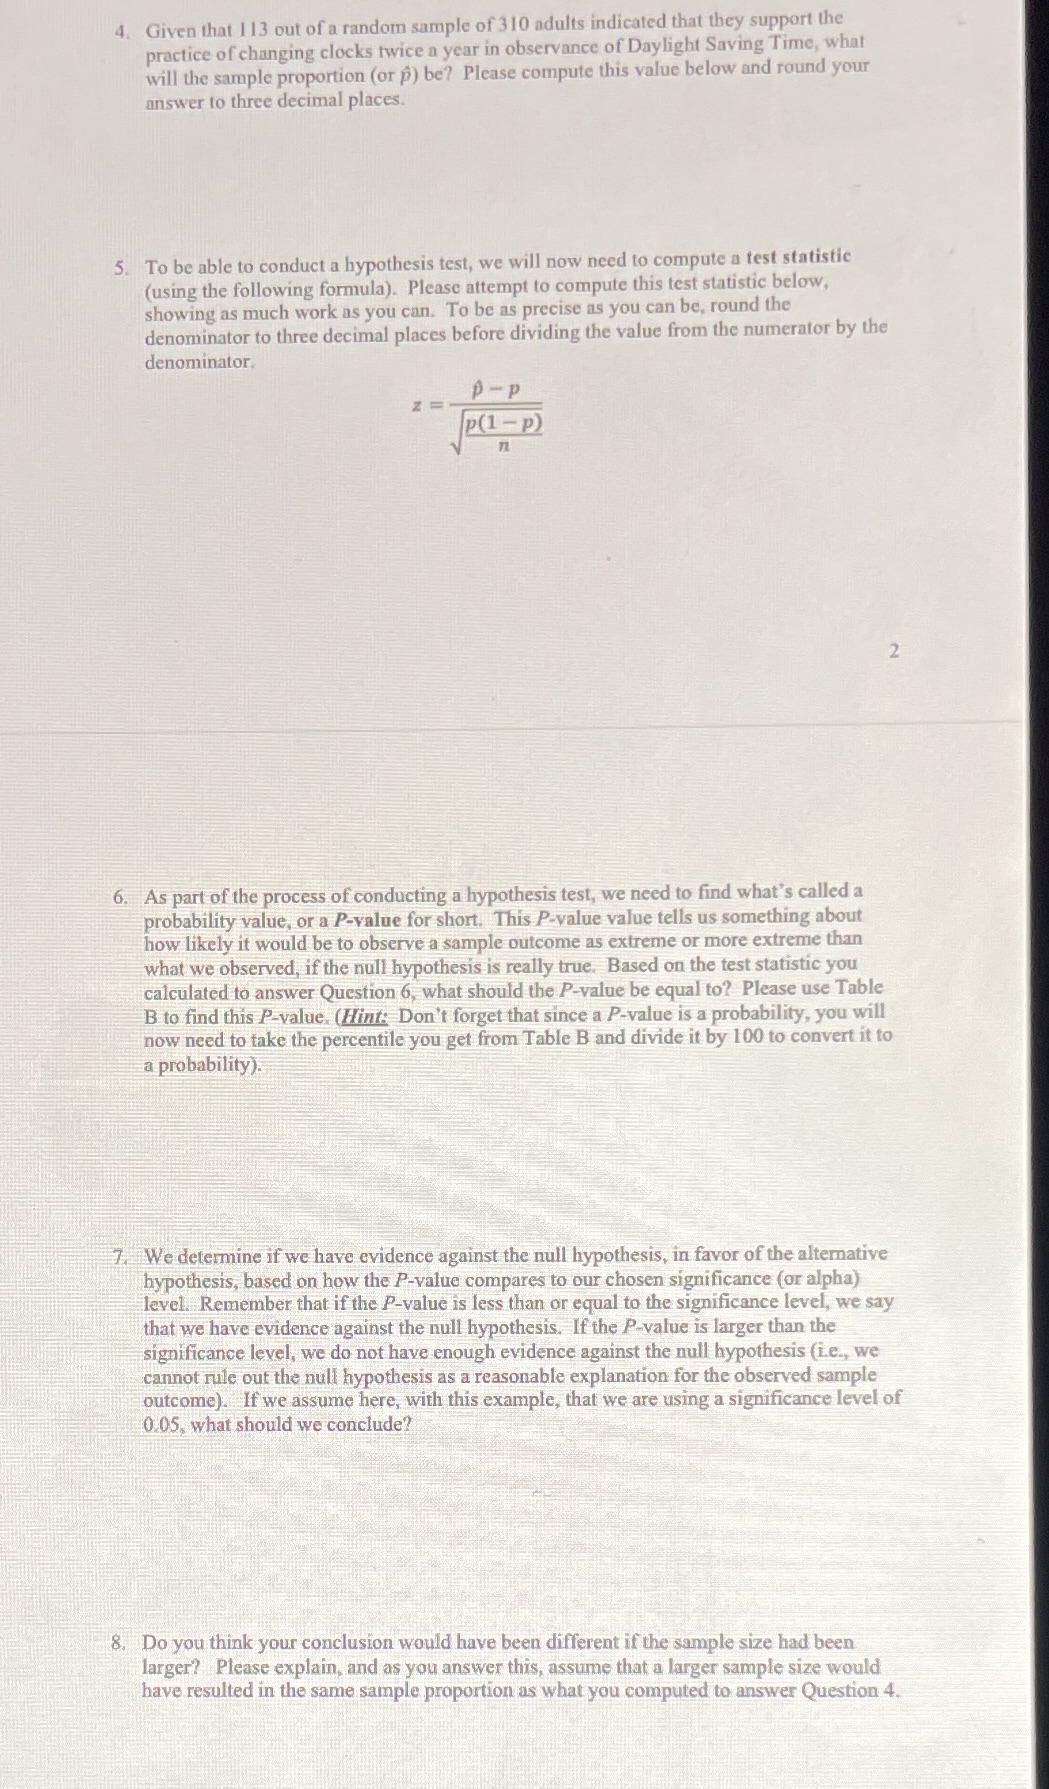
4. Given that 1 13 out of a random sample of 310 adults indicated that they support the practice of changing clocks twice a year in observance of Daylight Saving Time, what will the sample proportion (or p) be? Please compute this value below and round your answer to three decimal places. 5. To be able to conduct a hypothesis test, we will now need to compute a test statistic (using the following formula). Please attempt to compute this test statistic below, showing as much work as you can. To be as precise as you can be, round the denominator to three decimal places before dividing the value from the numerator by the denominator. p -p P(1 - P) n 6. As part of the process of conducting a hypothesis test, we need to find what's called a probability value, or a P-value for short. This P-value value tells us something about how likely it would be to observe a sample outcome as extreme or more extreme than what we observed, if the null hypothesis is really true. Based on the test statistic you calculated to answer Question 6, what should the P-value be equal to? Please use Table B to find this P-value. (Hint: Don't forget that since a P-value is a probability, you will now need to take the percentile you get from Table B and divide it by 100 to convert it to a probability). 7. We determine if we have evidence against the null hypothesis, in favor of the alternative hypothesis, based on how the P-value compares to our chosen significance (or alpha) level. Remember that if the P-value is less than or equal to the significance level, we say that we have evidence against the null hypothesis. If the P-value is larger than the significance level, we do not have enough evidence against the null hypothesis (i.e., we cannot rule out the null hypothesis as a reasonable explanation for the observed sample outcome). If we assume here, with this example, that we are using a significance level of 0.05, what should we conclude? 8. Do you think your conclusion would have been different if the sample size had been larger? Please explain, and as you answer this, assume that a larger sample size would have resulted in the same sample proportion as what you computed to answer Question 4
Step by Step Solution
There are 3 Steps involved in it

Get step-by-step solutions from verified subject matter experts