

Question: 4. Iffe scatterplot at nigfit describes life relationship between the age (in years) and 21 price (in thousands of dollars) for used Ford 20 Explorers.
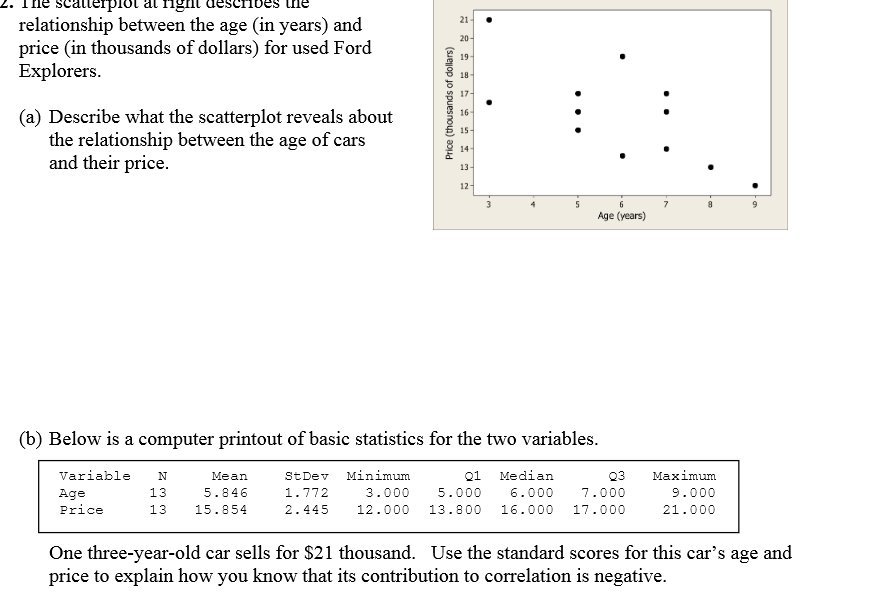
4. Iffe scatterplot at nigfit describes life relationship between the age (in years) and 21 price (in thousands of dollars) for used Ford 20 Explorers. 19 18 17- (a) Describe what the scatterplot reveals about 16 the relationship between the age of cars 15 - 14 and their price. Price (thousands of dollars) 13 12 - 6 7 A Age (years) (b) Below is a computer printout of basic statistics for the two variables. Variable N Mean StDev Minimum Q1 Median 03 Maximum Age 13 5. 846 1 . 772 3.000 5.000 6.000 7.000 9.000 Price 13 15 . 854 2. 445 12. 000 13 . 800 16.000 17.000 21.000 One three-year-old car sells for $21 thousand. Use the standard scores for this car's age and price to explain how you know that its contribution to correlation is negative
Step by Step Solution
There are 3 Steps involved in it

Get step-by-step solutions from verified subject matter experts