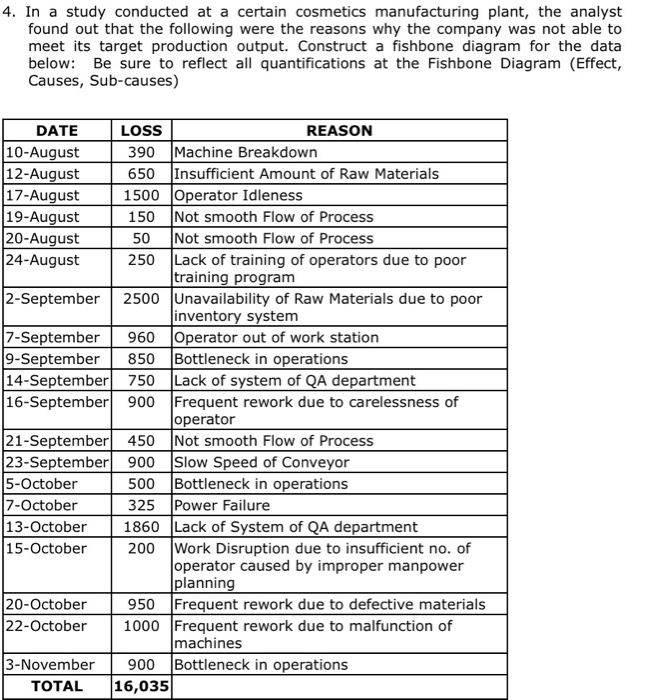
Question: 4. In a study conducted at a certain cosmetics manufacturing plant, the analyst found out that the following were the reasons why the company was

4. In a study conducted at a certain cosmetics
4. In a study conducted at a certain cosmetics manufacturing plant, the analyst found out that the following were the reasons why the company was not able to meet its target production output. Construct a fishbone diagram for the data below: Be sure to reflect all quantifications at the Fishbone Diagram (Effect, Causes, Sub-causes) DATE LOSS REASON 10-August 390 Machine Breakdown 12-August 650 Insufficient Amount of Raw Materials 17-August 1500 Operator Idleness 19-August 150 Not smooth Flow of Process (20-August 50 Not smooth Flow of Process 24-August 250 Lack of training of operators due to poor training program 2-September 2500 Unavailability of Raw Materials due to poor inventory system 7-September 960 Operator out of work station 9-September 850 Bottleneck in operations 14-September 750 Lack of system of QA department 16-September 900 Frequent rework due to carelessness of operator 21-September 450 Not smooth Flow of Process 23-September 900 Slow Speed of Conveyor 5-October 500 Bottleneck in operations 7-October 325 Power Failure 13-October 1860 Lack of System of QA department 15-October 200 Work Disruption due to insufficient no. of operator caused by improper manpower planning 20-October 950 Frequent rework due to defective materials 22-October 1000 Frequent rework due to malfunction of machines 3-November 900 Bottleneck in operations TOTAL 16,035

Step by Step Solution

There are 3 Steps involved in it

1 Expert Approved Answer
Step: 1 Unlock blur-text-image
Question Has Been Solved by an Expert!

Get step-by-step solutions from verified subject matter experts

Step: 2 Unlock
Step: 3 Unlock

Students Have Also Explored These Related General Management Questions!