

Question: 4. Interpret the sample statistics table (interpret the Mean and SD as well as state who expended more METS). In addition, interpret the t-test analysis
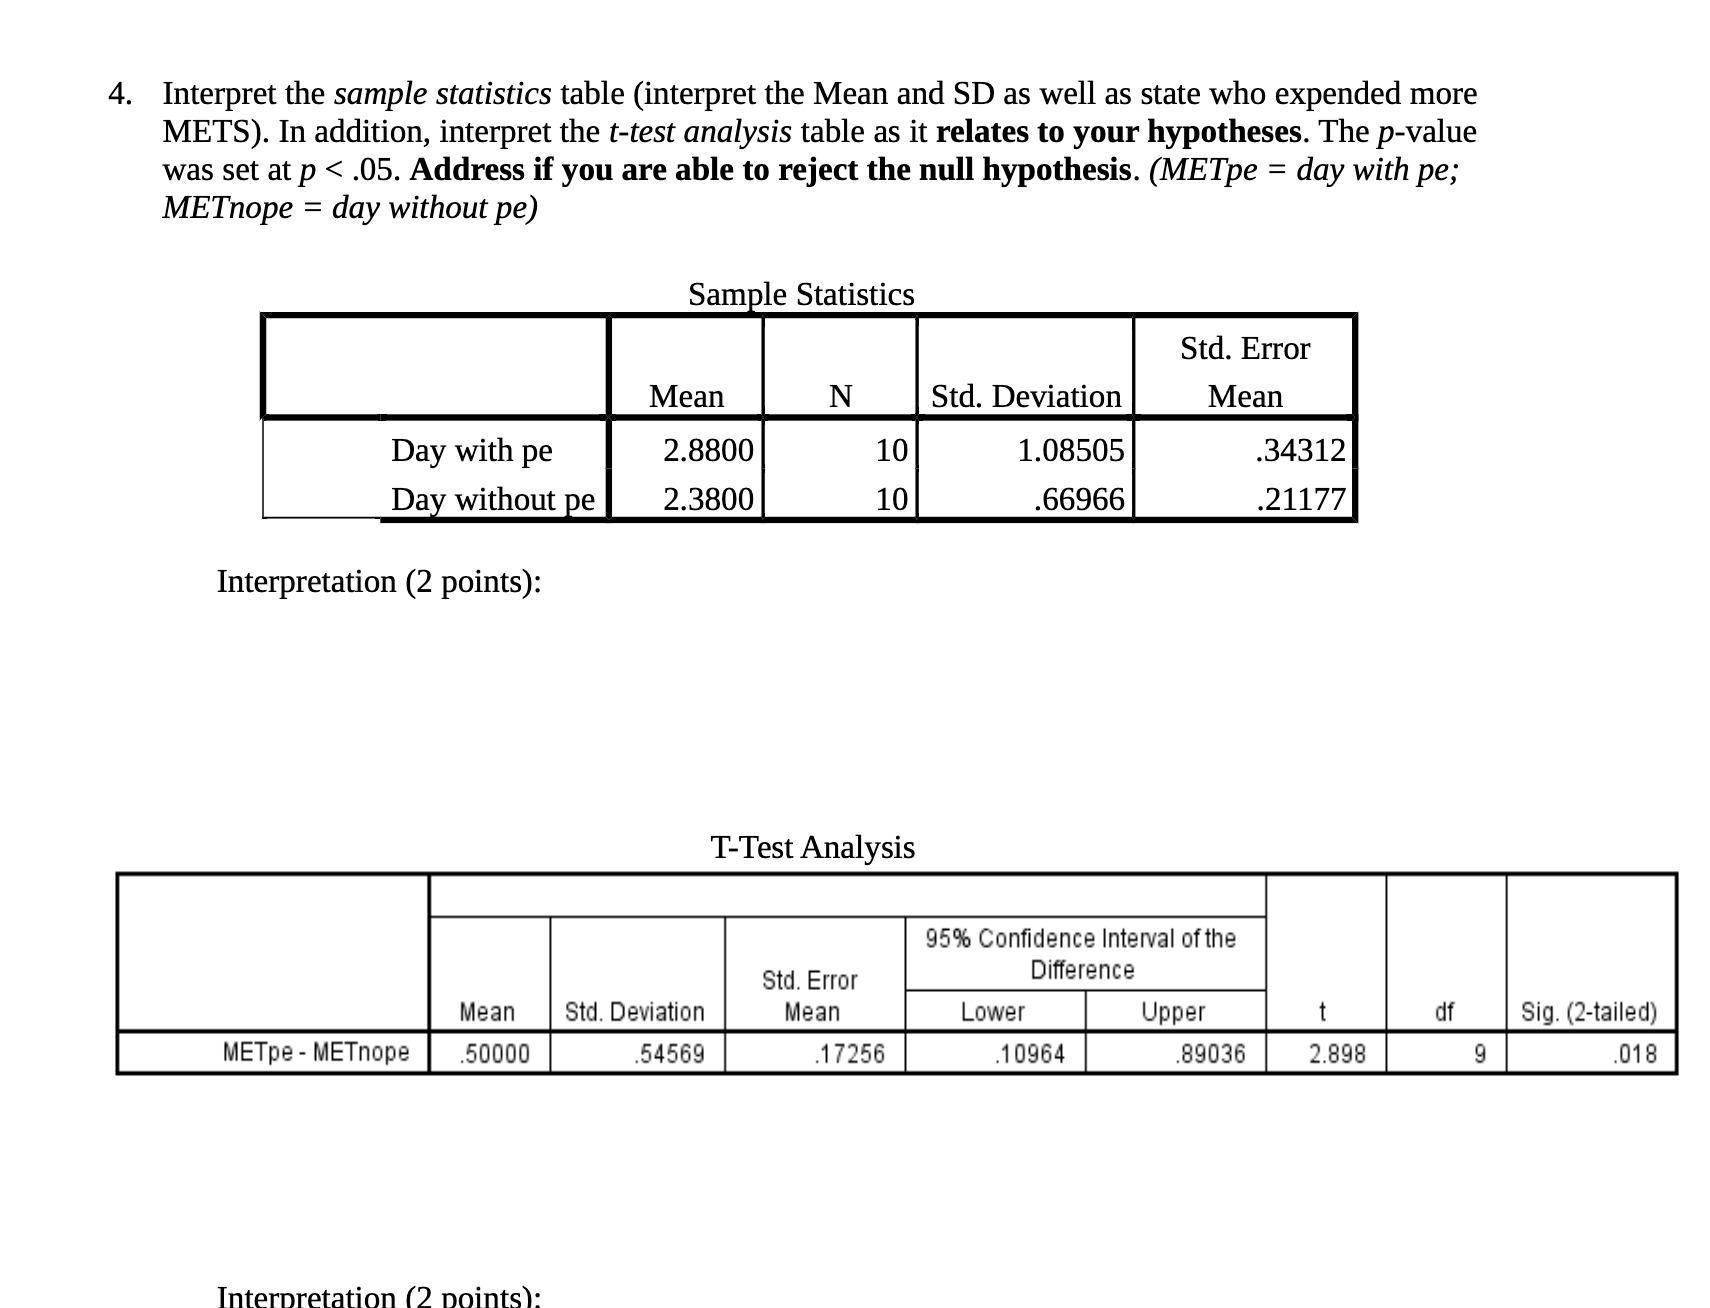
4. Interpret the sample statistics table (interpret the Mean and SD as well as state who expended more METS). In addition, interpret the t-test analysis table as it relates to your hypotheses. The p-value was set at p
Step by Step Solution
There are 3 Steps involved in it
1 Expert Approved Answer
Step: 1 Unlock

Question Has Been Solved by an Expert!
Get step-by-step solutions from verified subject matter experts
Step: 2 Unlock
Step: 3 Unlock