

Question: 4) Listed below is a Frequency Table, the data represents the years of experience that the New York Yankees baseball players have. a) State the
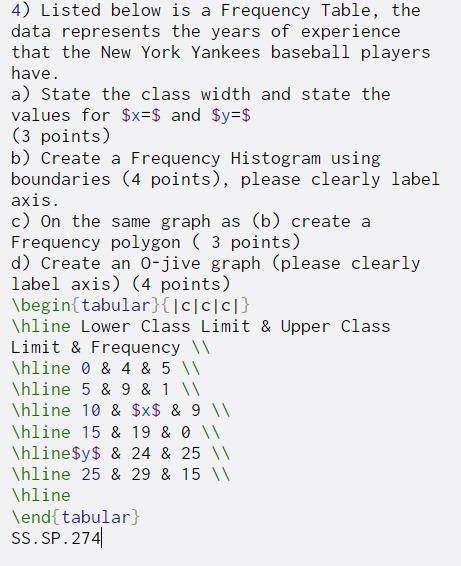
4) Listed below is a Frequency Table, the data represents the years of experience that the New York Yankees baseball players have. a) State the class width and state the values for $x=$ and $y=$ (3 points) b) Create a Frequency Histogram using boundaries (4 points), please clearly label axis. c) On the same graph as (b) create a Frequency polygon ( 3 points) d) Create an 0-jive graph (please clearly label axis) (4 points) \begin{tabular}{|C|CC|} \hline Lower Class Limit & Upper Class Limit & Frequency \hline 0 & 4 & 5 \hline 5 & 9 & 1 \hline 10 & $x$ & 9 \hline 15 & 19 & 0 \hline $y$ & 24 & 25 W \hline 25 & 29 & 15 W \hline \end{tabulary SS.SP. 274
Step by Step Solution
There are 3 Steps involved in it

Get step-by-step solutions from verified subject matter experts