Question: 4. Perform a financial analysis for a project using the format provided in Figure 4-5. Assume that the projected costs and benefits for this project
4. Perform a financial analysis for a project using the format provided in Figure 4-5. Assume that the projected costs and benefits for this project are spread over four years as follows: Estimated costs are $300,000 in Year 1 and $40,000 each year in Years 2, 3, and 4. Estimated benefits are $0 in Year 1 and $120,000 each year in Years 2, 3, and 4. Use a 7 percent discount rate, and round the discount factors to two decimal places. Create a spreadsheet to calculate and clearly display the NPV, ROI and year in which payback occurs. In addition, write a paragraph explaining whether you would recommend investing in this project, based on your financial analysis. 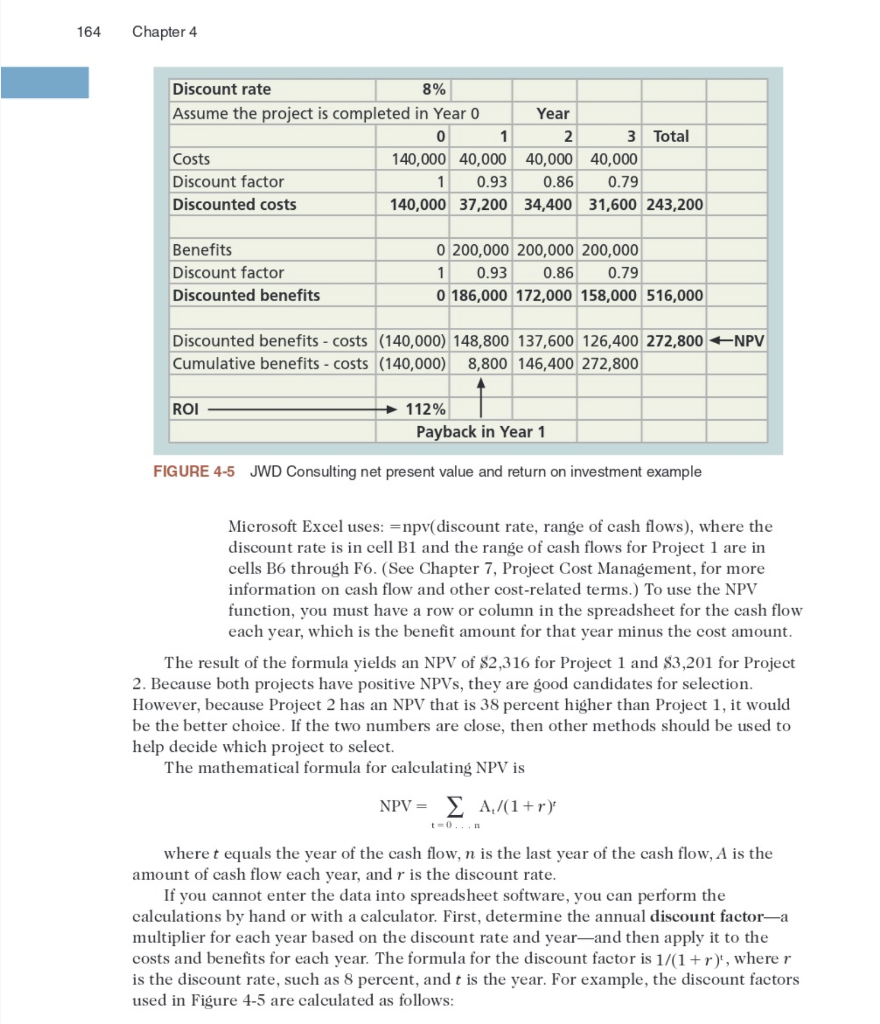
164 Chapter 4 Discount rate 8% Assume the project is completed in Year 0 Year 0 1 2 3 Total Costs 140,000 40,000 40,000 40,000 Discount factor 1 0.93 0.86 0.79 Discounted costs 140,000 37,200 34,400 31,600 243,200 Benefits Discount factor Discounted benefits 0 200,000 200,000 200,000 1 0.93 0.86 0.79 0 186,000 172,000 158,000 516,000 Discounted benefits - costs (140,000) 148,800 137,600 126,400 272,800 NPV Cumulative benefits - costs (140,000) 8,800 146,400 272,800 ROI 112% Payback in Year 1 FIGURE 4-5 JWD Consulting net present value and return on investment example Microsoft Excel uses: =npv(discount rate, range of cash flows), where the discount rate is in cell B1 and the range of cash flows for Project 1 are in cells B6 through F6. (See Chapter 7, Project Cost Management, for more information on cash flow and other cost-related terms.) To use the NPV function, you must have a row or column in the spreadsheet for the cash flow each year, which is the benefit amount for that year minus the cost amount. The result of the formula yields an NPV of $2,316 for Project 1 and $3,201 for Project 2. Because both projects have positive NPVs, they are good candidates for selection. However, because Project 2 has an NPV that is 38 percent higher than Project 1, it would be the better choice. If the two numbers are close, then other methods should be used to help decide which project to select. The mathematical formula for calculating NPV is NPV = ,/(1+r): where t equals the year of the cash flow, n is the last year of the cash flow, A is the amount of cash flow each year, and r is the discount rate. If you cannot enter the data into spreadsheet software, you can perform the calculations by hand or with a calculator. First, determine the annual discount factor-a multiplier for each year based on the discount rate and yearand then apply it to the costs and benefits for each year. The formula for the discount factor is 1/(1+r)', where r is the discount rate, such as 8 percent, and t is the year. For example, the discount factors used in Figure 4-5 are calculated as follows


