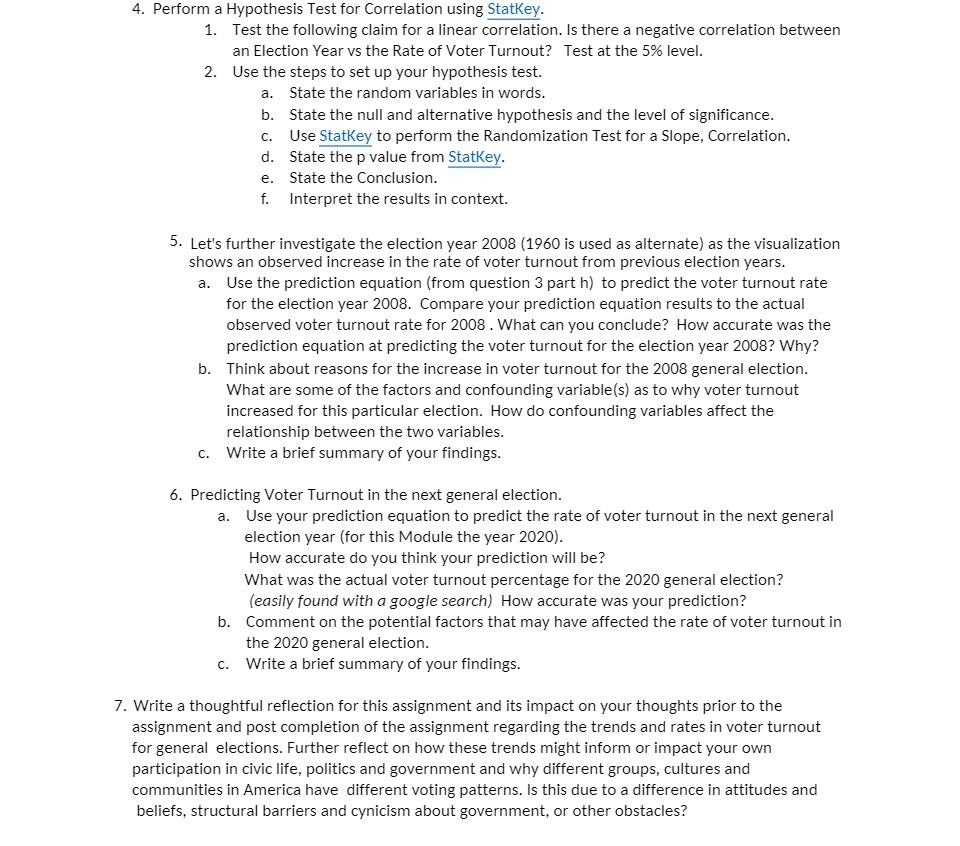
Question: 4. Perform a Hypothesis Test for Correlation using StatKey. 1. Test the following claim for a linear correlation. Is there a negative correlation between an

4. Perform a Hypothesis Test for Correlation
4. Perform a Hypothesis Test for Correlation using StatKey. 1. Test the following claim for a linear correlation. Is there a negative correlation between an Election Year vs the Rate of Voter Turnout? Test at the 5% level. 2. Use the steps to set up your hypothesis test. a. State the random variables in words. State the null and alternative hypothesis and the level of signicance. Use StatKey to perform the Randomization Test for a Slope, Correlation. State the p value from Statltey. State the Conclusion. Interpret the results in context. weeps 5- Let's further investigate the election year 2008 (1960 is used as alternate] as the visualization shows an observed increase in the rate of voter turnout from previous election years. a. Use the prediction equation (from question 3 part h) to predict the voter turnout rate for the election year 2008. Compare your prediction equation results to the actual observed voter turnout rate for 2008 . What can you conclude? How accurate was the prediction equation at predicting the voter turnout for the election year 2008? Why? b. Think about reasons for the increase in voter turnout for the 2008 general election. What are some of the factors and confounding variablets} as to why voter turnout increased for this particular election. How do confounding variables affect the relationship between the two variables. c. Write a brief summary of your findings. 6- Predicting Voter Turnout in the next general election. a. Use your prediction equation to predict the rate of voter turnout in the next general election year {for this Module the year 2020). How accurate do you think your prediction will be? What was the actual voter turnout percentage for the 2020 general election? [easily found with a google search;I How accurate was your prediction? b. Comment on the potential factors that may have affected the rate of voter turnout in the 2020 general election. c. Write a brief summary of your ndings. 7'. Write a thoughtful reflection for this assignment and its impact on your thoughts prior to the assignment and post completion of the assignment regarding the trends and rates in voter turnout for general elections. Further reflect on how these trends might inform or impact your own participation in civic life, politics and government and why different groups, cultures and communities in America have different voting patterns. Is this due to a difference in attitudes and beliefs, structural barriers and cynicism about government, or other obstacles

Step by Step Solution

There are 3 Steps involved in it

1 Expert Approved Answer
Step: 1 Unlock blur-text-image
Question Has Been Solved by an Expert!

Get step-by-step solutions from verified subject matter experts

Step: 2 Unlock
Step: 3 Unlock

Students Have Also Explored These Related Mathematics Questions!