

Question: 4. Plot the data given in the following table on an Extreme Value Type I probability scale (Gumbel paper) using the reduced variate y as
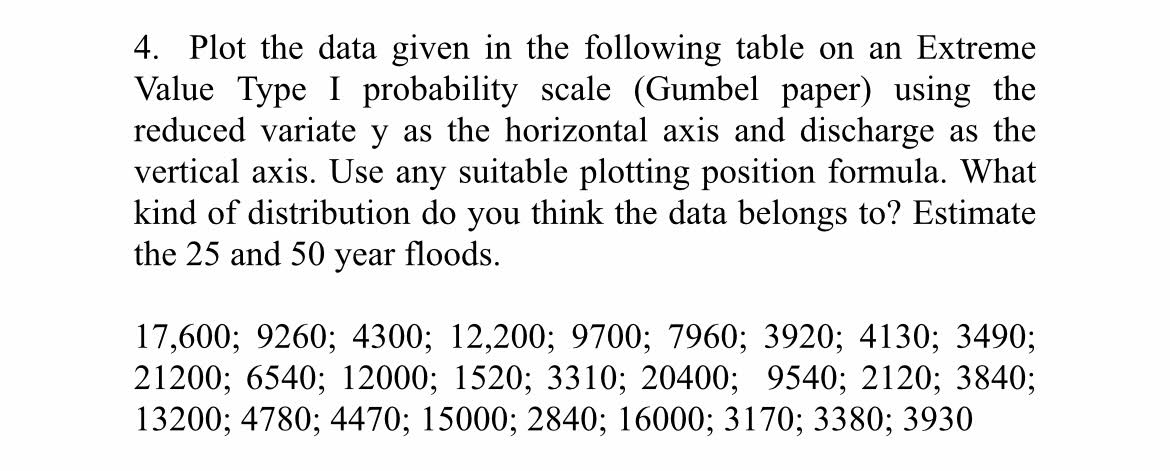
4. Plot the data given in the following table on an Extreme Value Type I probability scale (Gumbel paper) using the reduced variate y as the horizontal axis and discharge as the vertical axis. Use any suitable plotting position formula. What kind of distribution do you think the data belongs to? Estimate the 25 and 50 year oods. 17,600; 9260; 4300; 12,200; 9700; 7960; 3920; 4130; 3490; 21200; 6540; 12000; 1520; 3310; 20400; 9540; 2120; 3840; 13200; 4780; 4470; 15000; 2840; 16000; 3170; 3380; 3930
Step by Step Solution
There are 3 Steps involved in it
1 Expert Approved Answer
Step: 1 Unlock

Question Has Been Solved by an Expert!
Get step-by-step solutions from verified subject matter experts
Step: 2 Unlock
Step: 3 Unlock