

Question: 4. Portfolio Theory and Analysis The attached file (MER & FFM Ass Returns Data.xls) gives 120 months returns for securities drawn from the FT ALL
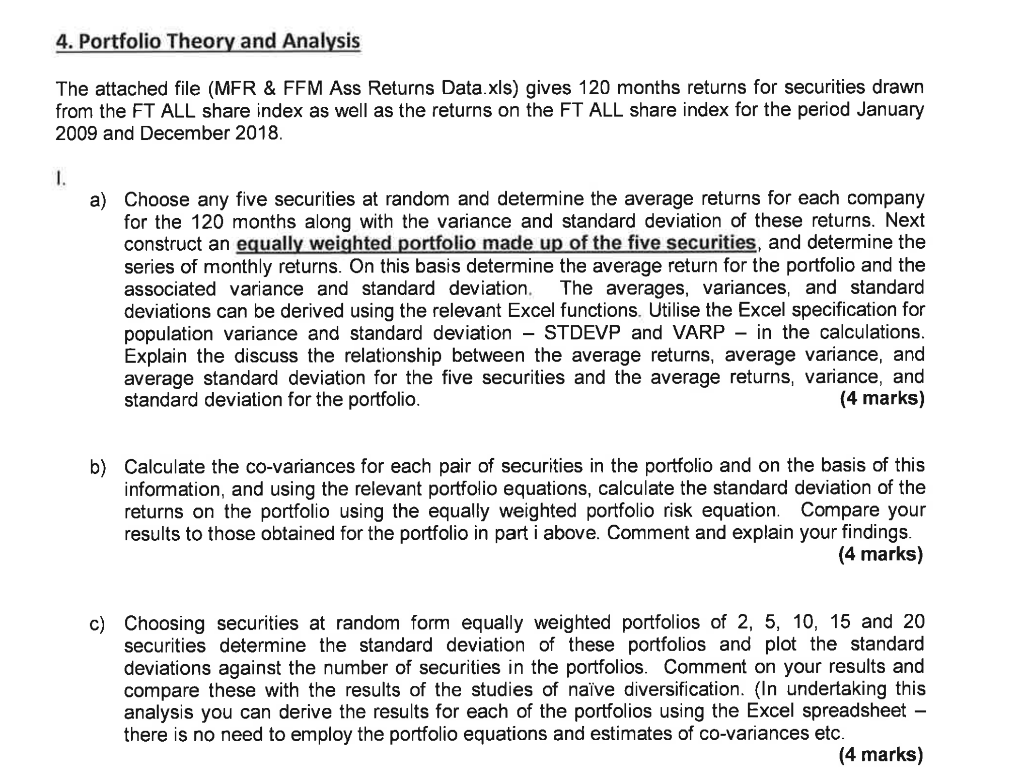
4. Portfolio Theory and Analysis The attached file (MER & FFM Ass Returns Data.xls) gives 120 months returns for securities drawn from the FT ALL share index as well as the returns on the FT ALL share index for the period January 2009 and December 2018. 1. a) Choose any five securities at random and determine the average returns for each company for the 120 months along with the variance and standard deviation of these returns. Next construct an equally weighted portfolio made up of the five securities, and determine the series of monthly returns. On this basis determine the average return for the portfolio and the associated variance and standard deviation. The averages, variances, and standard deviations can be derived using the relevant Excel functions. Utilise the Excel specification for population variance and standard deviation - STDEVP and VARP - in the calculations. Explain the discuss the relationship between the average returns, average variance, and average standard deviation for the five securities and the average returns, variance, and standard deviation for the portfolio. (4 marks) b) Calculate the co-variances for each pair of securities in the portfolio and on the basis of this information, and using the relevant portfolio equations, calculate the standard deviation of the returns on the portfolio using the equally weighted portfolio risk equation. Compare your results to those obtained for the portfolio in part i above. Comment and explain your findings. (4 marks) c) Choosing securities at random form equally weighted portfolios of 2, 5, 10, 15 and 20 securities determine the standard deviation of these portfolios and plot the standard deviations against the number of securities in the portfolios. Comment on your results and compare these with the results of the studies of nave diversification. (In undertaking this analysis you can derive the results for each of the portfolios using the Excel spreadsheet - there is no need to employ the portfolio equations and estimates of co-variances etc. (4 marks) 4. Portfolio Theory and Analysis The attached file (MER & FFM Ass Returns Data.xls) gives 120 months returns for securities drawn from the FT ALL share index as well as the returns on the FT ALL share index for the period January 2009 and December 2018. 1. a) Choose any five securities at random and determine the average returns for each company for the 120 months along with the variance and standard deviation of these returns. Next construct an equally weighted portfolio made up of the five securities, and determine the series of monthly returns. On this basis determine the average return for the portfolio and the associated variance and standard deviation. The averages, variances, and standard deviations can be derived using the relevant Excel functions. Utilise the Excel specification for population variance and standard deviation - STDEVP and VARP - in the calculations. Explain the discuss the relationship between the average returns, average variance, and average standard deviation for the five securities and the average returns, variance, and standard deviation for the portfolio. (4 marks) b) Calculate the co-variances for each pair of securities in the portfolio and on the basis of this information, and using the relevant portfolio equations, calculate the standard deviation of the returns on the portfolio using the equally weighted portfolio risk equation. Compare your results to those obtained for the portfolio in part i above. Comment and explain your findings. (4 marks) c) Choosing securities at random form equally weighted portfolios of 2, 5, 10, 15 and 20 securities determine the standard deviation of these portfolios and plot the standard deviations against the number of securities in the portfolios. Comment on your results and compare these with the results of the studies of nave diversification. (In undertaking this analysis you can derive the results for each of the portfolios using the Excel spreadsheet - there is no need to employ the portfolio equations and estimates of co-variances etc. (4 marks)
Step by Step Solution
There are 3 Steps involved in it

Get step-by-step solutions from verified subject matter experts