

Question: 4 pts Question 7 KE KE The graph in the upper left in red and black above shows the velocity v of an object on
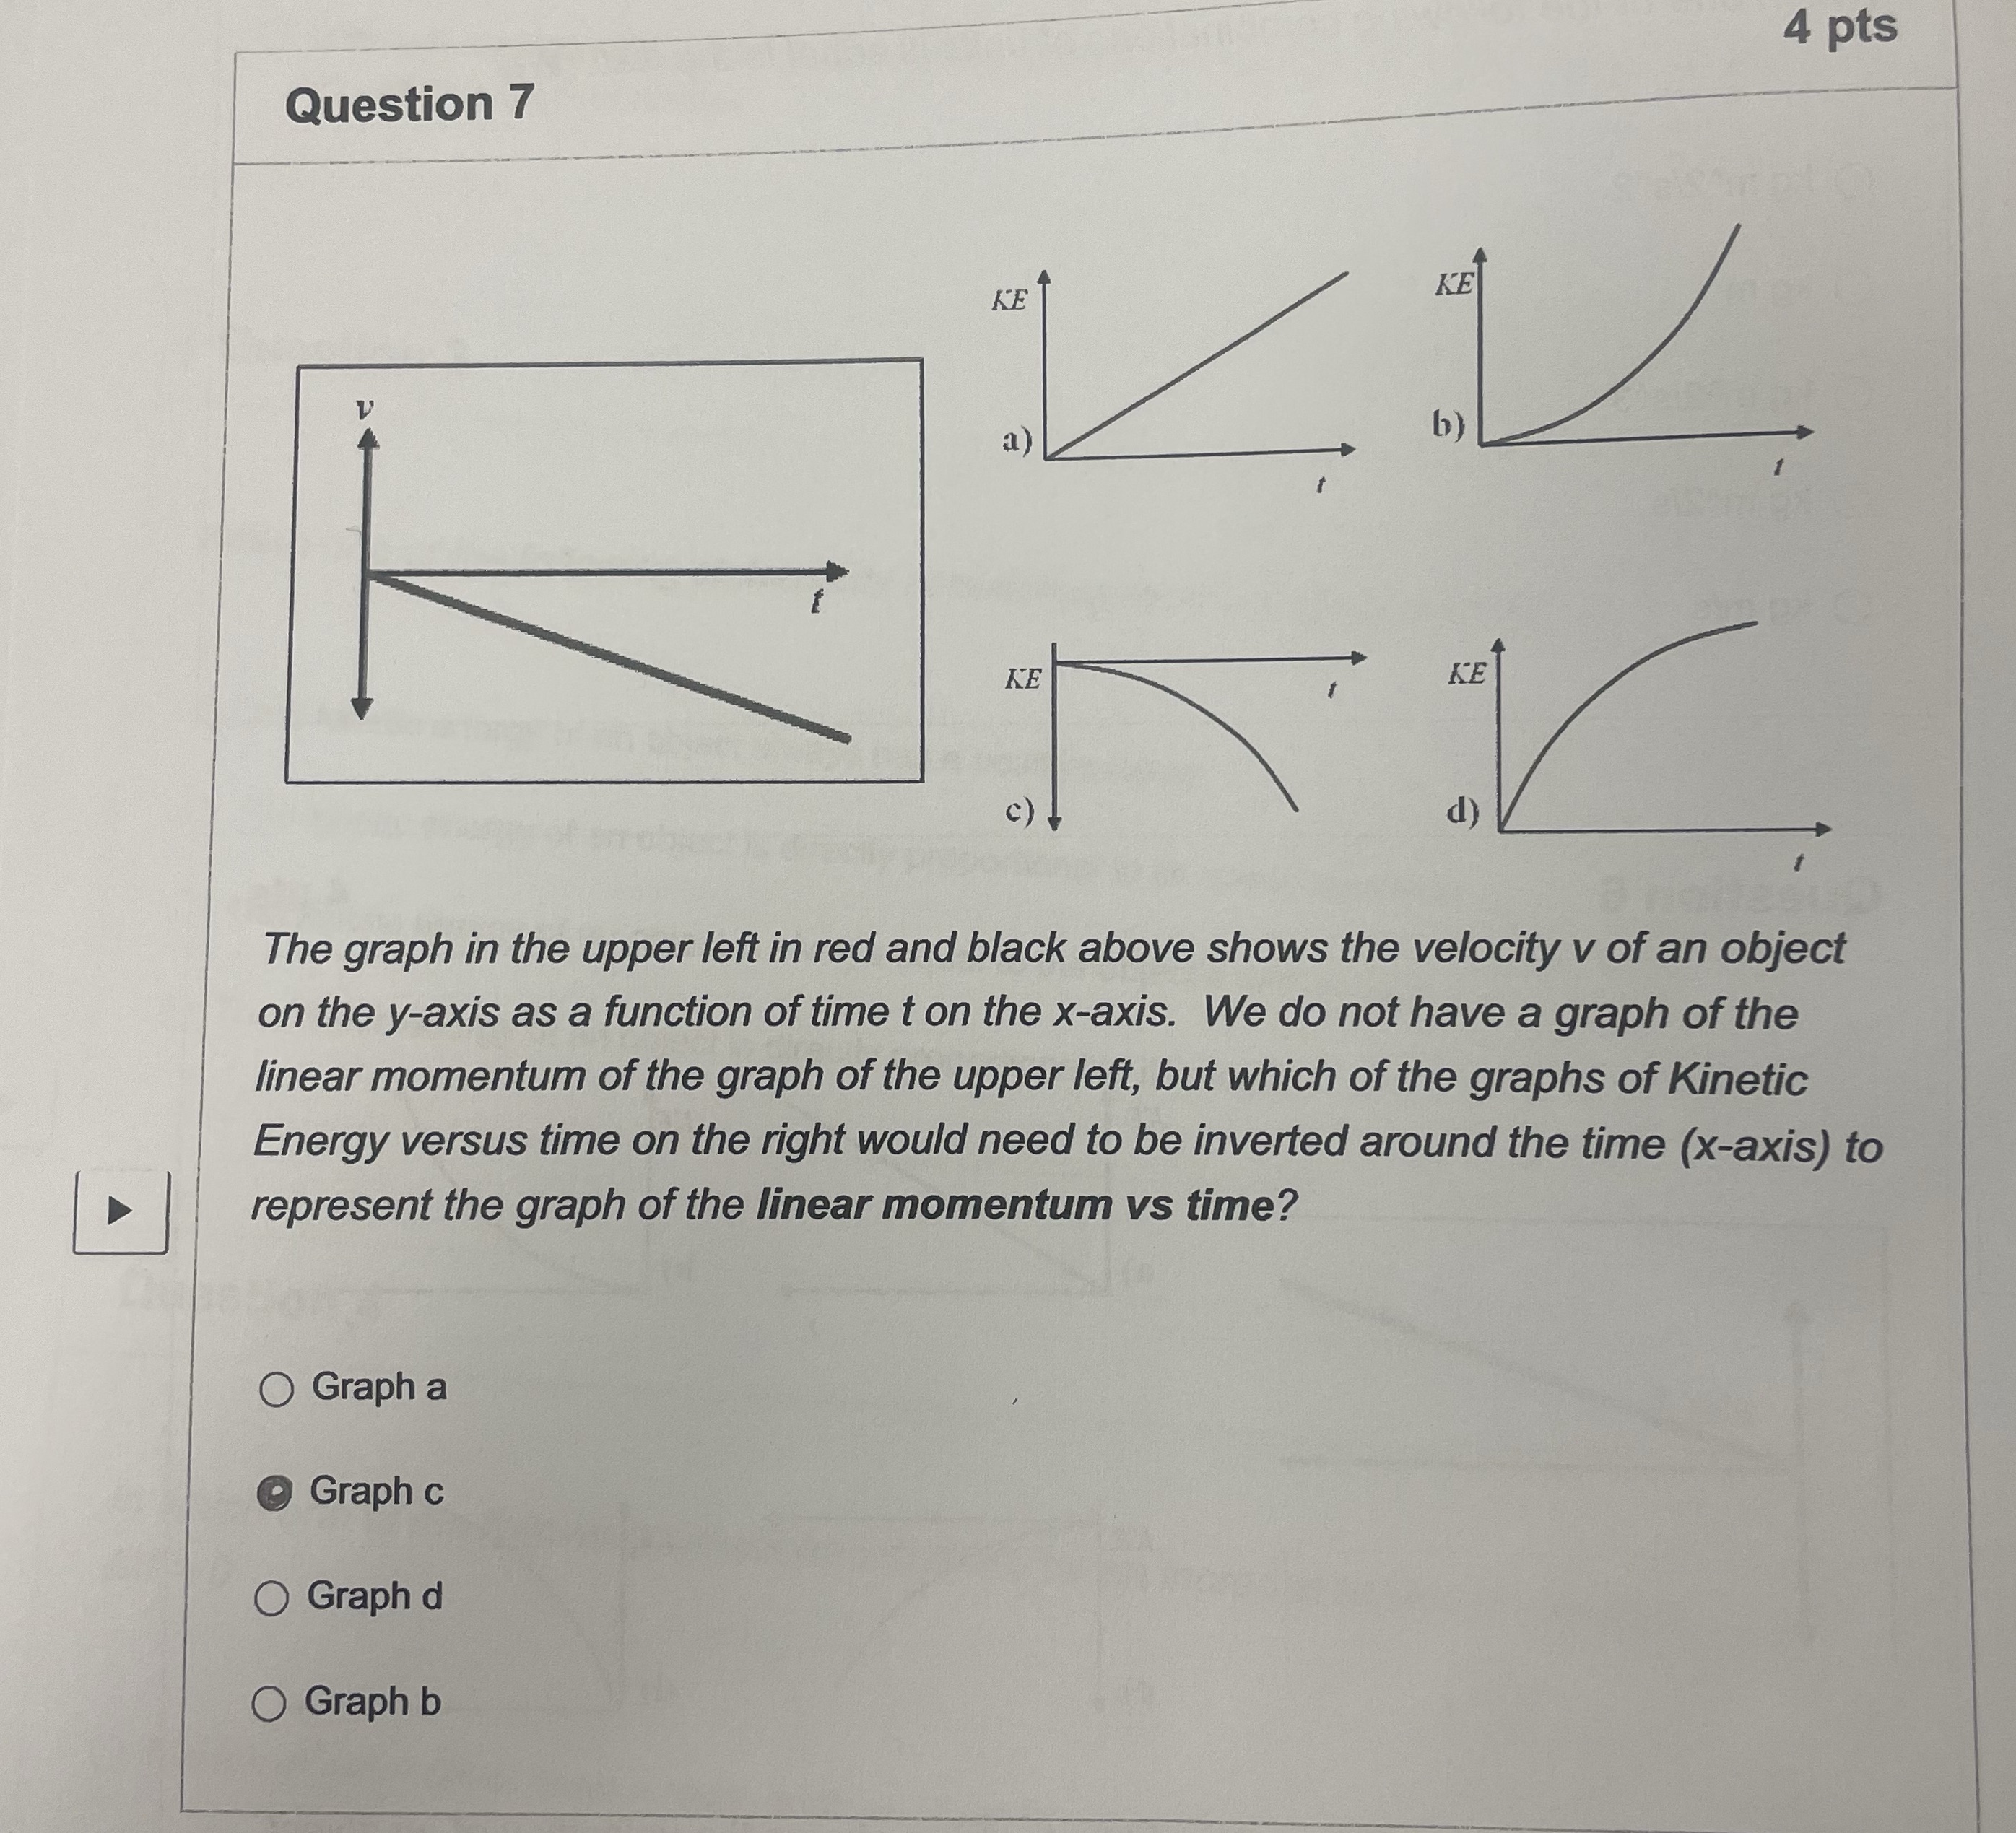
4 pts Question 7 KE KE The graph in the upper left in red and black above shows the velocity v of an object on the y-axis as a function of time t on the x-axis. We do not have a graph of the linear momentum of the graph of the upper left, but which of the graphs of Kinetic Energy versus time on the right would need to be inverted around the time (x-axis) to represent the graph of the linear momentum vs time? O Graph a Graph c O Graph d O Graph b
Step by Step Solution
There are 3 Steps involved in it
1 Expert Approved Answer
Step: 1 Unlock

Question Has Been Solved by an Expert!
Get step-by-step solutions from verified subject matter experts
Step: 2 Unlock
Step: 3 Unlock