

Question: 4. quan You may need to use the appropriate appendix table or technology to answer this question. A report states that adults 18- to 24-
4. quan
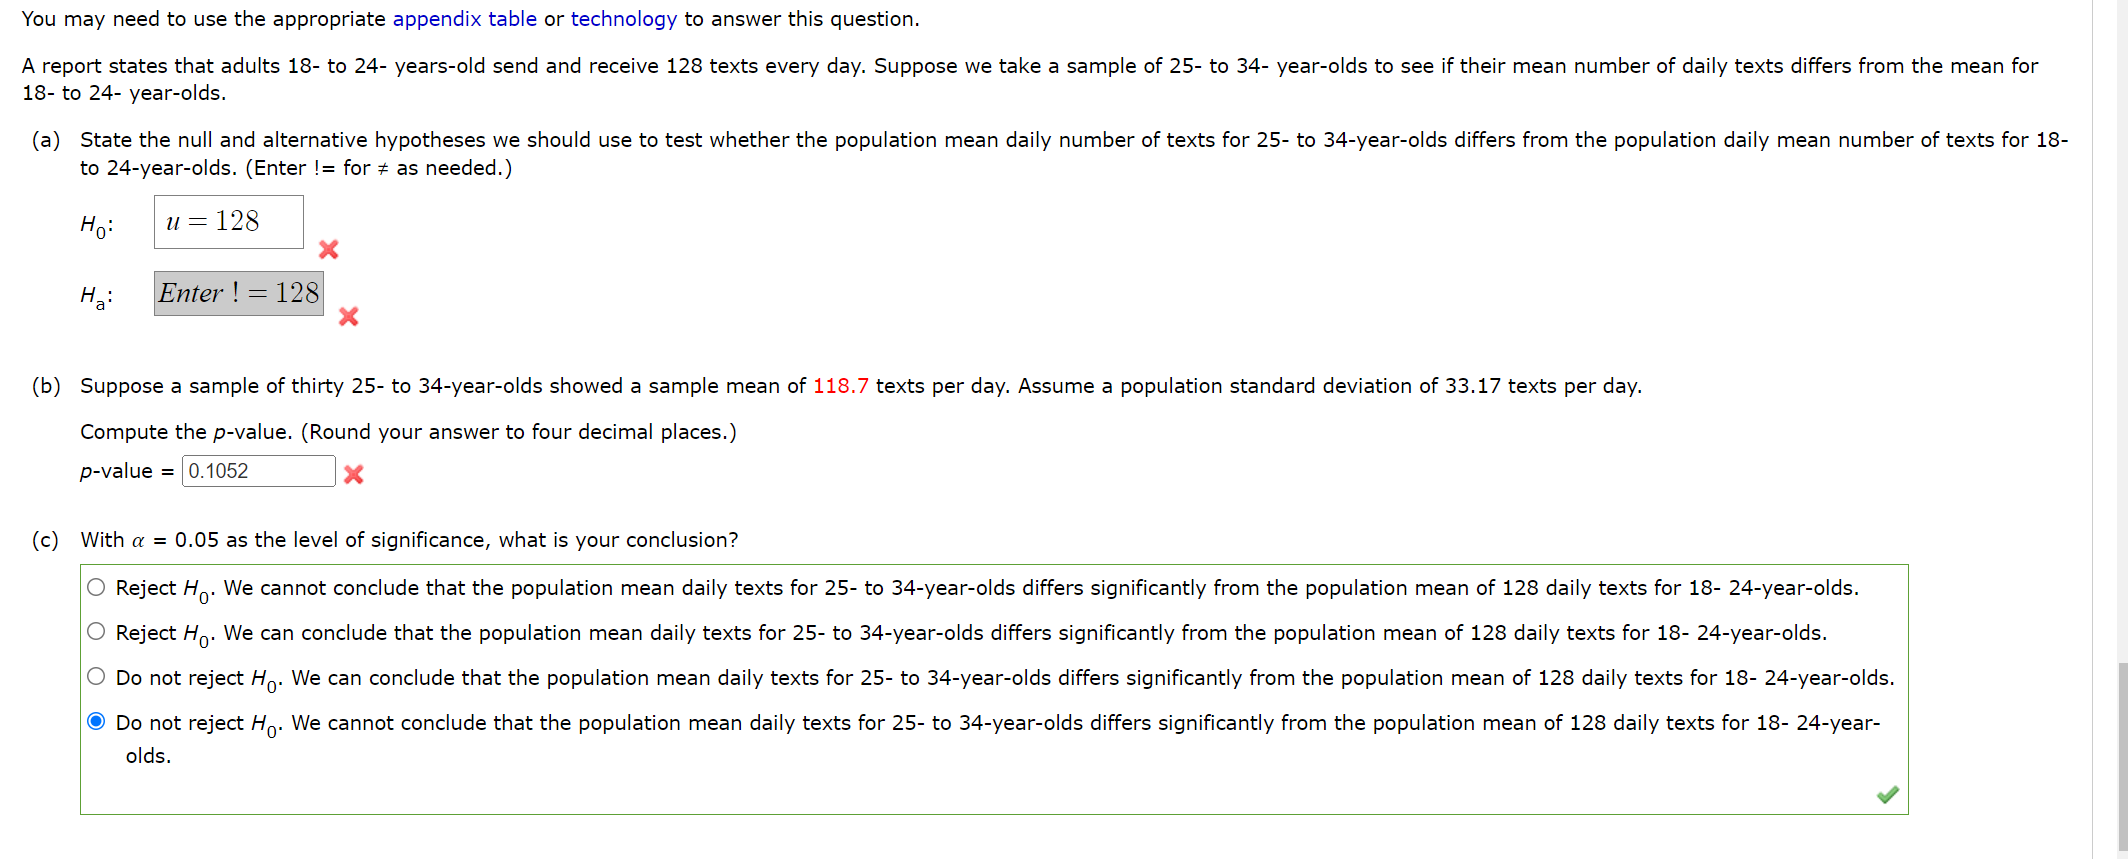
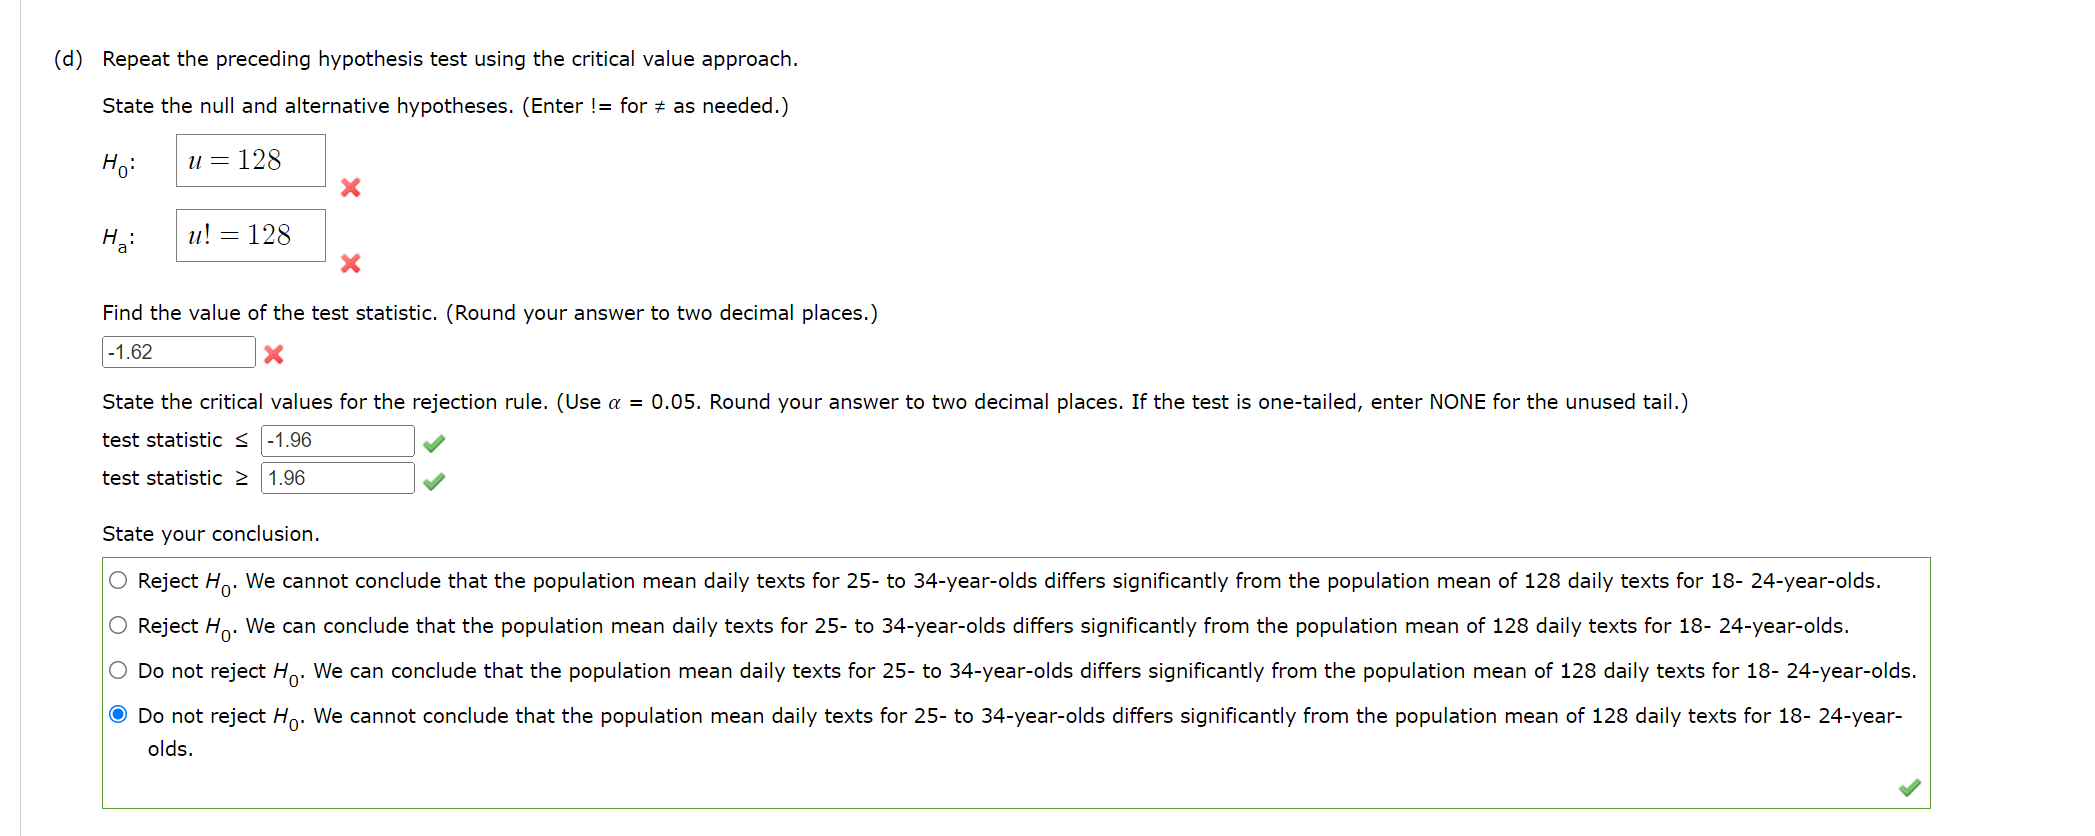
You may need to use the appropriate appendix table or technology to answer this question. A report states that adults 18- to 24- years-old send and receive 128 texts every day. Suppose we take a sample of 25- to 34- yearolds to see if their mean number of daily texts differs from the mean for 18- to 24 yearolds. (a) State the null and alternative hypotheses we should use to test whether the population mean daily number of texts for 25- to 34-yearolds differs from the population daily mean number of texts for 18- to 24year-olds. (Enter != for as needed.) u:128 H0: X H : Enter ! : 128 a X (b) Suppose a sample of twirty 25- to 34-year-olds showed a sample mean of 118.7 texts per day. Assume a population standard deviation of 33.17 texts per day. Compute the p-value. (Round your answer to four decimal places.) pvalue = 0.1052 x (c) With a = 0.05 as the level of signicance, what is your conclusion? O Reject H0. We cannot conclude that the population mean daily texts for 25 to 34-yearolds differs significantly from the population mean of 128 daily texts for 18- 24year-olds. O Reject H0. We can conclude that the population mean daily texts for 25 to 34year-olds differs signicantly from the population mean of 128 daily texts for 18- 24-year-olds. 0 Do not reject Ho- We can conclude that the population mean daily texts for 25- to 34-year-olds differs significantly from the population mean of 128 daily texts for 18- 24year-olds. Do not reject Ho- We cannot conclude that the population mean daily texts for 25- to 34-year-olds differs signicantly from the population mean of 128 daily texts for 18- 24year olds. I (d) Repeat the preceding hypothesis test using the critical value approach. State the null and alternative hypotheses. (Enter != for 2 as needed.) H: u:128 l] X H: u!:128 a X Find the value of the test statistic. (Round your answer to two decimal places.) x State the critical values for the rejection rule. (Use a: = 0.05. Round your answer to two decimal places. If the test is onetailed, enter NONE for the unused tail.) test statistic S test statistic 2 State your conclusion. O Reject H0. We cannot conclude that the population mean daily texts for 25 to 34-yearolds differs significantly from the population mean of 128 daily texts for 18- 24year-olds. O Reject H0. We can conclude that the population mean daily texts for 25- to 34-year-olds differs signicantly from the population mean of 128 daily texts for 18- 24-year-olds. 0 Do not reject HO. We can conclude that the population mean daily texts for 25- to 34-yearolds differs significantly from the population mean of 128 daily texts for 18- 24year-olds. (Q Do not reject Ho- We cannot conclude that the population mean daily texts for 25- to 34-year-olds differs signicantly from the population mean of 128 daily texts for 18- 24year olds
Step by Step Solution
There are 3 Steps involved in it

Get step-by-step solutions from verified subject matter experts