

Question: 4. Statistical measures of standalone risk Remember, the expected value of a probability distribution is a statistical measure of the average (mean) value expected to
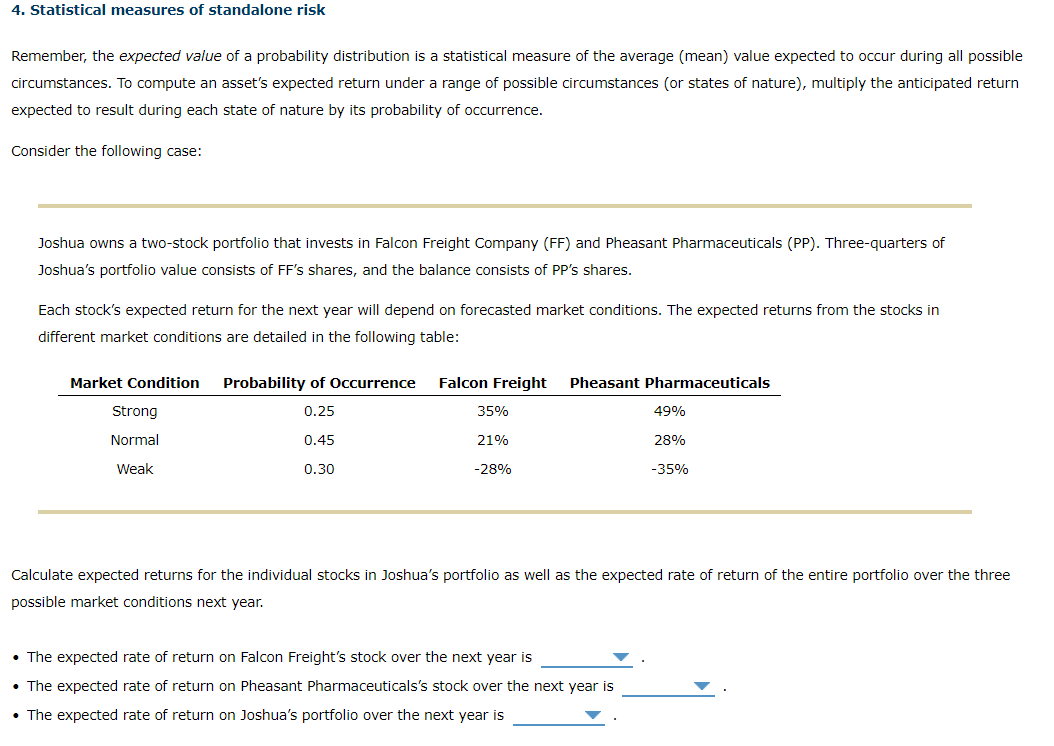
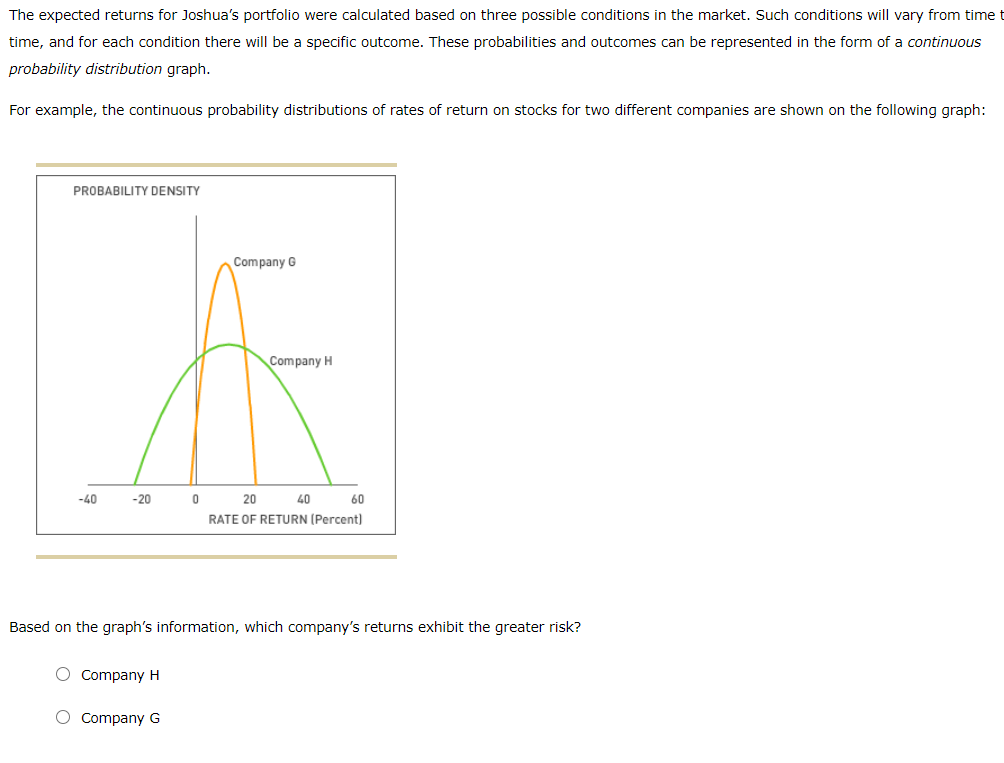
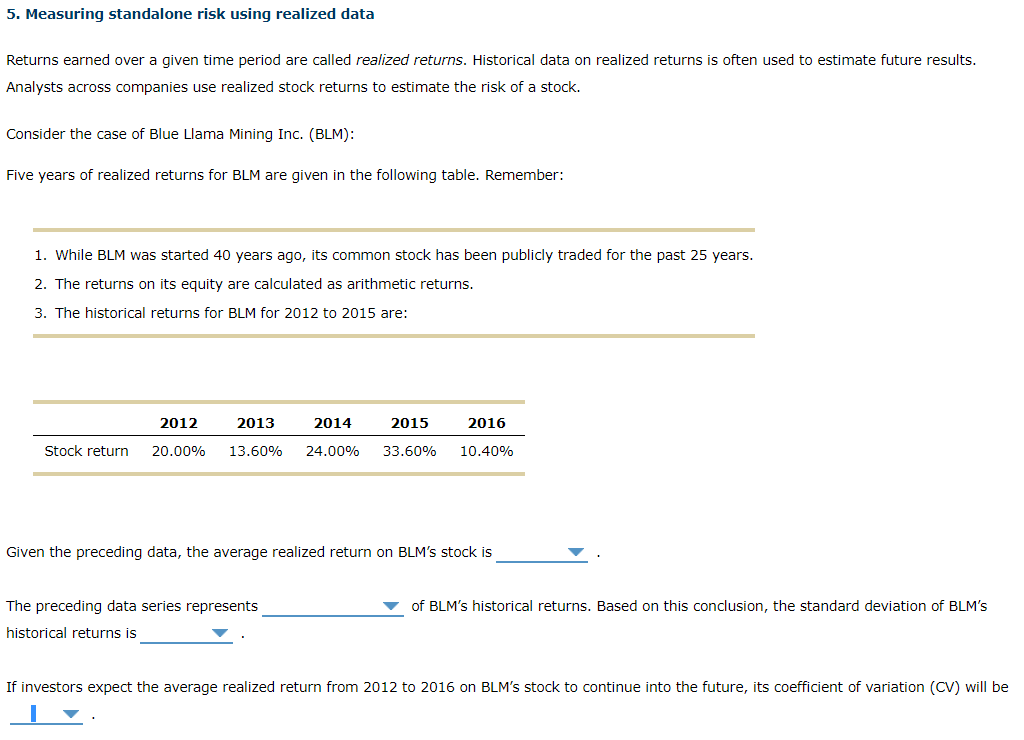
4. Statistical measures of standalone risk Remember, the expected value of a probability distribution is a statistical measure of the average (mean) value expected to occur during all possible circumstances. To compute an asset's expected return under a range of possible circumstances (or states of nature), multiply the anticipated return expected to result during each state of nature by its probability of occurrence. Consider the following case: Joshua owns a two-stock portfolio that invests in Falcon Freight Company (FF) and Pheasant Pharmaceuticals (PP). Three-quarters of Joshua's portfolio value consists of FF's shares, and the balance consists of PP's shares. Each stock's expected return for the next year will depend on forecasted market conditions. The expected returns from the stocks in different market conditions are detailed in the following table: Market Condition Probability of Occurrence Falcon Freight Pheasant Pharmaceuticals 0.25 35% 49% Strong Normal 0.45 21% 28% Weak 0.30 -28% -35% Calculate expected returns for the individual stocks in Joshua's portfolio as well as the expected rate of return of the entire portfolio over the three possible market conditions next year. The expected rate of return on Falcon Freight's stock over the next year is The expected rate of return on Pheasant Pharmaceuticals's stock over the next year is The expected rate of return on Joshua's portfolio over the next year is The expected returns for Joshua's portfolio were calculated based on three possible conditions in the market. Such conditions will vary from time t time, and for each condition there will be a specific outcome. These probabilities and outcomes can be represented in the form of a continuous probability distribution graph. For example, the continuous probability distributions of rates of return on stocks for two different companies are shown on the following graph: PROBABILITY DENSITY Company G Company H -40 -20 0 20 40 60 RATE OF RETURN (Percent) Based on the graph's information, which company's returns exhibit the greater risk? O Company H O Company G 5. Measuring standalone risk using realized data Returns earned over a given time period are called realized returns. Historical data on realized returns is often used to estimate future results. Analysts across companies use realized stock returns to estimate the risk of a stock. Consider the case of Blue Llama Mining Inc. (BLM): Five years of realized returns for BLM are given in the following table. Remember: 1. While BLM was started 40 years ago, its common stock has been publicly traded for the past 25 years. 2. The returns on its equity are calculated as arithmetic returns. 3. The historical returns for BLM for 2012 to 2015 are: 2012 2013 2014 2015 2016 Stock return 20.00% 13.60% 24.00% 33.60% 10.40% Given the preceding data, the average realized return on BLM's stock is The preceding data series represents of BLM's historical returns. Based on this conclusion, the standard deviation of BLM'S historical returns is If investors expect the average realized return from 2012 to 2016 on BLM's stock to continue into the future, its coefficient of variation (CV) will be
Step by Step Solution
There are 3 Steps involved in it

Get step-by-step solutions from verified subject matter experts