

Question: 4 . The data in A 3 - MicroBreweries is based on that in an economic study of the microbrewing industry in Ireland in
The data in A MicroBreweries" is based on that in an economic study of the microbrewing industry in Ireland in It has counts of microbreweries per county, with the counties then classified into economic regions a simplified classification based on the NUTS system For each of the following graphscharts choose a suitable colour scheme, Title, Axes, Legend, and any other appropriate graphical aesthetics.
a Create a geographic map a "choropleth" map, to be precise in Excel, showing the number of microbreweries per county.
b Create a Tree Map, showing the subdivision into Regions and Counties. Include data labels showing the actual counts of microbreweries.
c Create a Clustered Column Chart with again counts by Region, and by County within Region. Sort the clusters and columns in the chart so that the largest of each come first ie leftmost in the chart
d For each of the above charts a to c state one question and answer for which that chart would be a good choice of evidence to support that answer. Take care to include suitable Guides eg axis titles and labels, chart title, legend, datasource annotation, etc. as appropriate.
HINTS:
Example Charts for Q
As we've seen there are many choices with charts and there's no one correct or even "best" answer. These are suggestions that may help you understand what's being asked for, but they aren't perfect answers!
Figure Qb
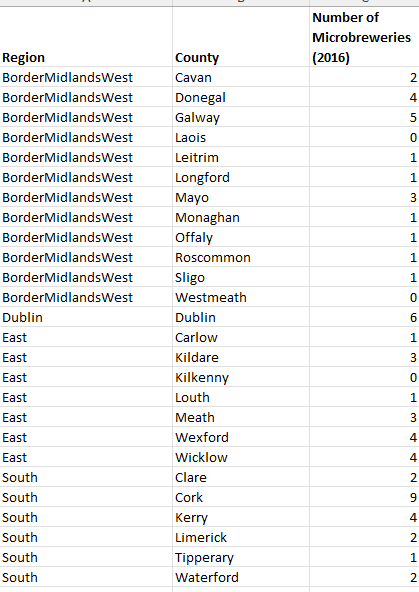
Figure QC begintabularccc
hline Region & County & Number of Microbreweries
hline BorderMidlandsWest & Cavan &
hline BorderMidlandsWest & Donegal &
hline BorderMidlandsWest & Galway &
hline BorderMidlandsWest & Laois &
hline BorderMidlandsWest & Leitrim &
hline BorderMidlandsWest & Longford &
hline BorderMidlandsWest & Mayo &
hline BorderMidlandsWest & Monaghan &
hline BorderMidlandsWest & Offaly &
hline BorderMidlandsWest & Roscommon &
hline BorderMidlandsWest & Sligo &
hline BorderMidlandsWest & Westmeath &
hline Dublin & Dublin &
hline East & Carlow &
hline East & Kildare &
hline East & Kilkenny &
hline East & Louth &
hline East & Meath &
hline East & Wexford &
hline East & Wicklow &
hline South & Clare &
hline South & Cork &
hline South & Kerry &
hline South & Limerick &
hline South & Tipperary &
hline South & Waterford &
hline
endtabular
Step by Step Solution
There are 3 Steps involved in it
1 Expert Approved Answer
Step: 1 Unlock

Question Has Been Solved by an Expert!
Get step-by-step solutions from verified subject matter experts
Step: 2 Unlock
Step: 3 Unlock