

Question: 4. The data listed here are the weights (in pounds) of 29 packages of beef in a supermarket meat display: .97 . . 1.02 .05

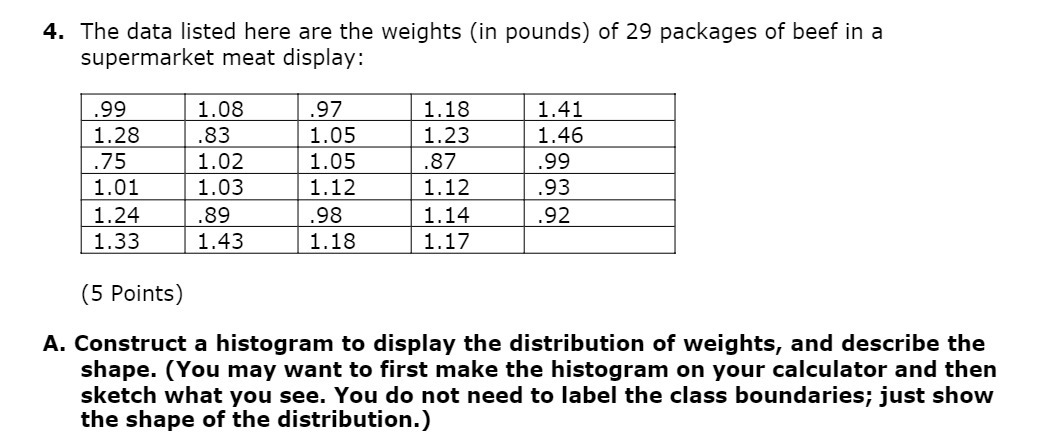
4. The data listed here are the weights (in pounds) of 29 packages of beef in a supermarket meat display: .97 . . 1.02 .05 . . 1.03 . 1.24 .89 98 1.14 92 1 33 1.43 1 18 1 17 (5 Points) A. Construct a histogram to display the distribution of weights, and describe the shape. (You may want to first make the histogram on your calculator and then sketch what you see. You do not need to label the class boundaries; just show the shape of the distribution.)
Step by Step Solution
There are 3 Steps involved in it
1 Expert Approved Answer
Step: 1 Unlock

Question Has Been Solved by an Expert!
Get step-by-step solutions from verified subject matter experts
Step: 2 Unlock
Step: 3 Unlock