

Question: 4. The Excel file Stock Data contains monthly data for several stocks and the S&P 500 Index (i.e., the market). a. Compute the average monthly
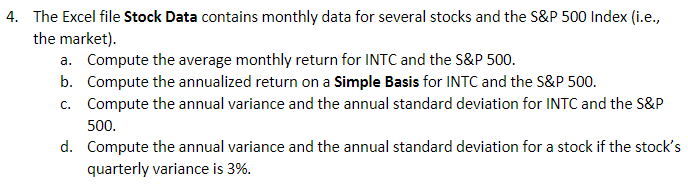
4. The Excel file Stock Data contains monthly data for several stocks and the S&P 500 Index (i.e., the market). a. Compute the average monthly return for INTC and the S&P 500. b. Compute the annualized return on a Simple Basis for INTC and the S&P 500. C. Compute the annual variance and the annual standard deviation for INTC and the S&P 500. d. Compute the annual variance and the annual standard deviation for a stock if the stock's quarterly variance is 3%. A G H 09 N st 5 A B D E F 1 Monthly Return Data for Several Stocks and the S&P 500 2 3 4 Month Cin Dell INTC MSFT NT 5 1 -2.90% -9.51% 1.94% -16.18% -3.23% 6 4.79% 10.51% 10.47% 12.03% 16.66% 7 3 2.91% 7.93% 12.07% 8.29% -0.72% 8 4 4.25% -7.34% -10.77% -12.40% 2.16% 9 5.30% -14.27% 5.18% 3.30% 13.38% 10 6 -0.88% 3.70% -1.64% 7.31% 10.56% 11 7 3.54% 1.78% 7.50 .59% -3.93% 12 8 3.76% - 15.77% 4.65% 19.34% 5.85% 13 9 2.94% -4.16% 2.96% 6.42% -2.76% 14 10 2.86% -4.34% -0.72% 0.00% 5.11% 15 11 -0.86% -15.88% 14.50% 6.32% 1.08% 16 12 0.41% 35.06% 1.90% 6.76% 3.74% 17 13 -2.85% 21.97% 3.73% 12.15% 2.06% 18 14 -3.05% 11.46% -5.39% 4.74% -4.55% 19 15 4.85% 29.49% 22.15% 25.86% 17.46% 20 16 1.26% 14.75% -2.59% 4.11% -0.45% 21 17 5.82% -6.92% -5.32% - 12.50% -1.81% 22 18 -7.20% 0.00% -24.99% -7.52% -11.98% 23 19 -0.86% -25.57% -0.38% 2.44% -2.09% 24 20 5.10% 21.51% 0.75% 1.19% 12.84% 25 21 1.69% 23.49% 11.94% 13.33% -2.37% 26 22 -0.83% 40.97% 2.66% 4.16% 9.71% 27 23 0.86% 22.31% 18.83% 30.40% -1.77% 28 24 4.66% 11.58% 4.37% 5.73% 5.86% 29 25 4.45% 12.89% -2.10% 2.29% 6.81% 30 26 0.34% -17.99% 5.35% -6.71% 11.55% 31 27 0.00% 5.87% 13.20% 10.86% 7.14% 32 28 1.18% -1.01% -16.59% -6.89% -2.67% 33 29 6.25% 17.36% 1.08% 7.89% 8.90% 34 30 0.37% 13.46% 5.32% 15.99% 0.31% 35 31 5.95% 2.32% -14.65% 4.40% -1.57% 36 32 0.00% -25.48% -3.83% 5.48% 6.69% 37 33 6.43% -5.52% 0.91% 3.59% 4.18% 38 34 7.72% 9.03% 19.51% 14.40% 3.15% 39 35 -6.22% 24.39% 22.21% 8.09% 3.89% 40 PFE 4.31% 7.61% -0.56% -5.94% 14.35% 6.54% -0.90% -1.45% 10.47% -6.24% -1.44% -13.12% 2.76% -6.39% 17.24% -2.66% 18.13% -5.49% -0.53% 3.01% 11.90% 0.00% 11.30% 17.59% 1.90% 1.87% 8.65% -5.73% 11.49% 6.43% -0.57% 9.98% -6.88% 26.55% -13.09% S&P 500 2.40% 5.20% 4.00% -0.50% 9.00% 1.90% -0.40% -2.30% 2.10% 2.40% -6.70% 1.30% 2.60% -2.50% 9.80% -0.70% -0.30% -9.00% -4.90% -0.40% 6.40% 2.70% 4.40% 7.20% 2.40% 0.30% 4.30% -4.60% 4.70% 2.40% -1.60% 1.30% -4.00% 11.40% -1.90% 4. The Excel file Stock Data contains monthly data for several stocks and the S&P 500 Index (i.e., the market). a. Compute the average monthly return for INTC and the S&P 500. b. Compute the annualized return on a Simple Basis for INTC and the S&P 500. C. Compute the annual variance and the annual standard deviation for INTC and the S&P 500. d. Compute the annual variance and the annual standard deviation for a stock if the stock's quarterly variance is 3%. A G H 09 N st 5 A B D E F 1 Monthly Return Data for Several Stocks and the S&P 500 2 3 4 Month Cin Dell INTC MSFT NT 5 1 -2.90% -9.51% 1.94% -16.18% -3.23% 6 4.79% 10.51% 10.47% 12.03% 16.66% 7 3 2.91% 7.93% 12.07% 8.29% -0.72% 8 4 4.25% -7.34% -10.77% -12.40% 2.16% 9 5.30% -14.27% 5.18% 3.30% 13.38% 10 6 -0.88% 3.70% -1.64% 7.31% 10.56% 11 7 3.54% 1.78% 7.50 .59% -3.93% 12 8 3.76% - 15.77% 4.65% 19.34% 5.85% 13 9 2.94% -4.16% 2.96% 6.42% -2.76% 14 10 2.86% -4.34% -0.72% 0.00% 5.11% 15 11 -0.86% -15.88% 14.50% 6.32% 1.08% 16 12 0.41% 35.06% 1.90% 6.76% 3.74% 17 13 -2.85% 21.97% 3.73% 12.15% 2.06% 18 14 -3.05% 11.46% -5.39% 4.74% -4.55% 19 15 4.85% 29.49% 22.15% 25.86% 17.46% 20 16 1.26% 14.75% -2.59% 4.11% -0.45% 21 17 5.82% -6.92% -5.32% - 12.50% -1.81% 22 18 -7.20% 0.00% -24.99% -7.52% -11.98% 23 19 -0.86% -25.57% -0.38% 2.44% -2.09% 24 20 5.10% 21.51% 0.75% 1.19% 12.84% 25 21 1.69% 23.49% 11.94% 13.33% -2.37% 26 22 -0.83% 40.97% 2.66% 4.16% 9.71% 27 23 0.86% 22.31% 18.83% 30.40% -1.77% 28 24 4.66% 11.58% 4.37% 5.73% 5.86% 29 25 4.45% 12.89% -2.10% 2.29% 6.81% 30 26 0.34% -17.99% 5.35% -6.71% 11.55% 31 27 0.00% 5.87% 13.20% 10.86% 7.14% 32 28 1.18% -1.01% -16.59% -6.89% -2.67% 33 29 6.25% 17.36% 1.08% 7.89% 8.90% 34 30 0.37% 13.46% 5.32% 15.99% 0.31% 35 31 5.95% 2.32% -14.65% 4.40% -1.57% 36 32 0.00% -25.48% -3.83% 5.48% 6.69% 37 33 6.43% -5.52% 0.91% 3.59% 4.18% 38 34 7.72% 9.03% 19.51% 14.40% 3.15% 39 35 -6.22% 24.39% 22.21% 8.09% 3.89% 40 PFE 4.31% 7.61% -0.56% -5.94% 14.35% 6.54% -0.90% -1.45% 10.47% -6.24% -1.44% -13.12% 2.76% -6.39% 17.24% -2.66% 18.13% -5.49% -0.53% 3.01% 11.90% 0.00% 11.30% 17.59% 1.90% 1.87% 8.65% -5.73% 11.49% 6.43% -0.57% 9.98% -6.88% 26.55% -13.09% S&P 500 2.40% 5.20% 4.00% -0.50% 9.00% 1.90% -0.40% -2.30% 2.10% 2.40% -6.70% 1.30% 2.60% -2.50% 9.80% -0.70% -0.30% -9.00% -4.90% -0.40% 6.40% 2.70% 4.40% 7.20% 2.40% 0.30% 4.30% -4.60% 4.70% 2.40% -1.60% 1.30% -4.00% 11.40% -1.90%
Step by Step Solution
There are 3 Steps involved in it

Get step-by-step solutions from verified subject matter experts