

Question: 4. The Excel file Stock Data contains monthly data for Stock A and the S&P 500 Index (i.e., the market). Assume the risk free
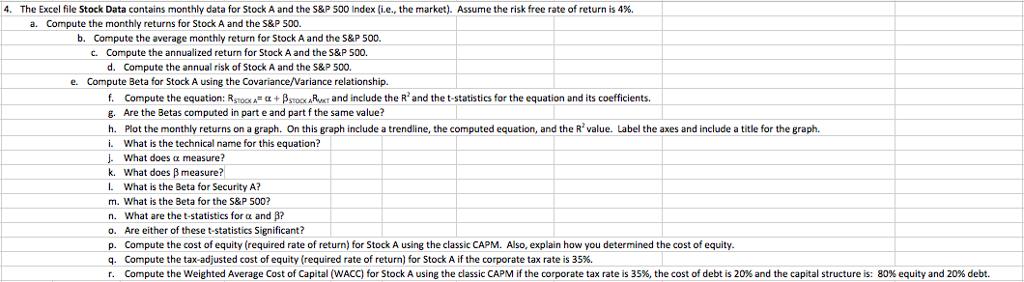

4. The Excel file Stock Data contains monthly data for Stock A and the S&P 500 Index (i.e., the market). Assume the risk free rate of return is 4%. a. Compute the monthly returns for Stock A and the S&P 500. b. Compute the average monthly return for Stock A and the S&P 500. c. Compute the annualized return for Stock A and the S&P 500. d. Compute the annual risk of Stock A and the S&P 500. e. Compute Beta for Stock A using the Covariance/Variance relationship. f. Compute the equation: RSTOCK A + BSTOCK ART and include the R and the t-statistics for the equation and its coefficients. g. Are the Betas computed in parte and part f the same value? h. Plot the monthly returns on a graph. On this graph include a trendline, the computed equation, and the R' value. Label the axes and include a title for the graph. i. What is the technical name for this equation? J. What does a measure? k. What does measure? 1. What is the Beta for Security A? m. What is the Beta for the S&P 500? n. What are the t-statistics for a and 3? o. Are either of these t-statistics Significant? p. Compute the cost of equity (required rate of return) for Stock A using the classic CAPM. Also, explain how you determined the cost of equity. q. Compute the tax-adjusted cost of equity (required rate of return) for Stock A if the corporate tax rate is 35%. r. Compute the Weighted Average Cost of Capital (WACC) for Stock A using the classic CAPM if the corporate tax rate is 35%, the cost of debt is 20% and the capital structure is: 80% equity and 20% debt. Date 1-Jul-03 990.31 1-Aug-03 1008.01 S&P 500 2-Sep-03 995.97 1-Oct-03 1050.71 3-Nov-03 1058.20 1-Dec-03 1111.92 2-Jan-04 1131.13 2-Feb-04 1144.94 Stock A 3-Jan-05 1181.27 1-Feb-05 1203.60 1-Mar-05 1180.59 1-Apr-05 1156.85 2-May-05 1191.50 1-Jun-05 1191.33 1-Jul-05 1234.18 19.49 19.14 19.59 20.93 22.70 24.23 25.71 23.16 1-Mar-04 1126.21 23.57 1-Apr-04 1107.30 20.911 3-May-04 1120.68 22.37 1-Jun-04 1140.84 23.70 1-Jul-04 1101.72 20.92 2-Aug-04 1104.24 18.76 1-Sep-04 1114.58 18.10 1-Oct-04 1130.20 19.21 1-Nov-04 1173.82 18.75 1-Dec-04 1211.92 19.32 18.04 17.42 17.89 17.27 19.40) 19.08 19.15
Step by Step Solution
3.41 Rating (154 Votes )
There are 3 Steps involved in it
A Compute the monthly returns for Stock A and the SP 500 Monthly Returns for Stock A July 03 194919141914 189 August 03 19141959119591 229 September 03 1959120932093 603 October 03 209322702270 807 No... View full answer

Get step-by-step solutions from verified subject matter experts