

Question: 4 The format in which information is presented is often vital. (a) If you were a harried marketing manager and queried your information system, would
4 The format in which information is presented is often vital. (a) If you were a harried marketing manager and queried your information system, would you rather see the results in tables or charts and graphs? (b) What are one or two strengths and weaknesses of each format?
5 (a) Why might a marketing researcher prefer to use secondary data rather than primary data in a study? (b) Why might the reverse be true?
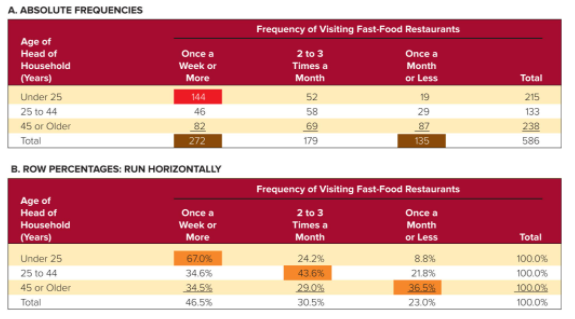
7 Look back at Figure 86A. (a) Run the percent-ages vertically and explain what they mean. (b) Express all numbers in the table as a percentage of the total number of people sampled (586) and explain what the percentages mean.
8 Which of the following variables would linear trend extrapolation be more accurate for? (a) An-nual population of the United States or (b) annual sales of cars produced in the United States by Ford. Why?
Figure 8-6A:
Step by Step Solution
There are 3 Steps involved in it

Get step-by-step solutions from verified subject matter experts