

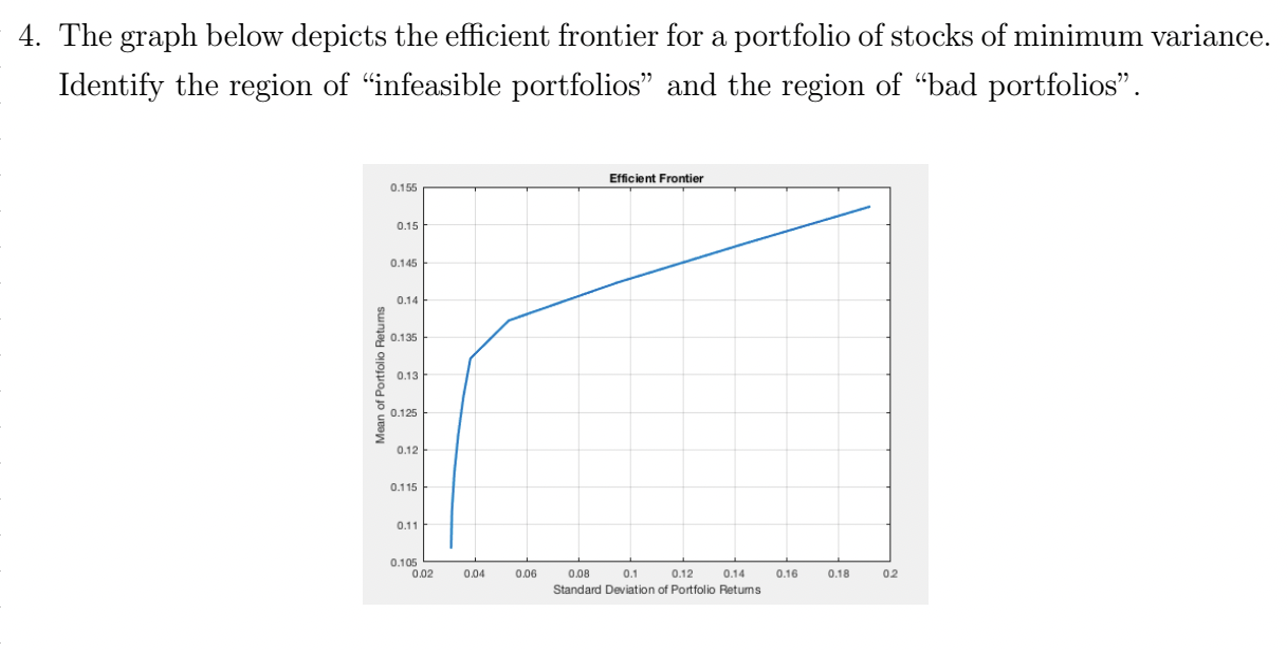
Question: 4. The graph below depicts the efficient frontier for a portfolio of stocks of minimum variance. Identify the region of infeasible portfolios and the region
Step by Step Solution
There are 3 Steps involved in it
1 Expert Approved Answer
Step: 1 Unlock

Question Has Been Solved by an Expert!
Get step-by-step solutions from verified subject matter experts
Step: 2 Unlock
Step: 3 Unlock