

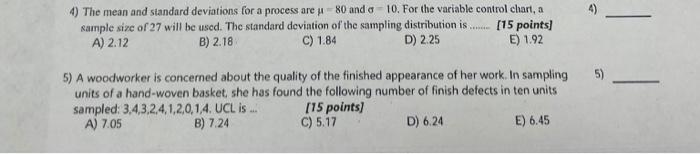
Question: 4) The mean and siandard deviations for a process are =80 and 10. For the variable control chart, a sample sire of 27 will be
Step by Step Solution
There are 3 Steps involved in it
1 Expert Approved Answer
Step: 1 Unlock

Question Has Been Solved by an Expert!
Get step-by-step solutions from verified subject matter experts
Step: 2 Unlock
Step: 3 Unlock