

Question: 4) The table below list the demand for 64 inches screens at local store for the past 7 weeks. Use the best of the following
4) The table below list the demand for 64 inches screens at local store for the past 7 weeks. Use the best of the following 2 Forecasting Method to compute the forecast the number of TV for period 8: 1) A 3 periods Moving Average Module. 2) A Weighted Moving Average forecasting tool, with the following weights: 5,2, and 7.
| Week | # of TV |
| 1 | 100 |
| 2 | 120 |
| 3 | 110 |
| 4 | 150 |
| 5 | 140 |
| 6 | 124 |
| 7 | 130 |
| 8 |
|
Options:
| 131.3 | ||
| 130.0 | ||
| 129.3 | ||
| 124.0 | ||
| 139.3 |
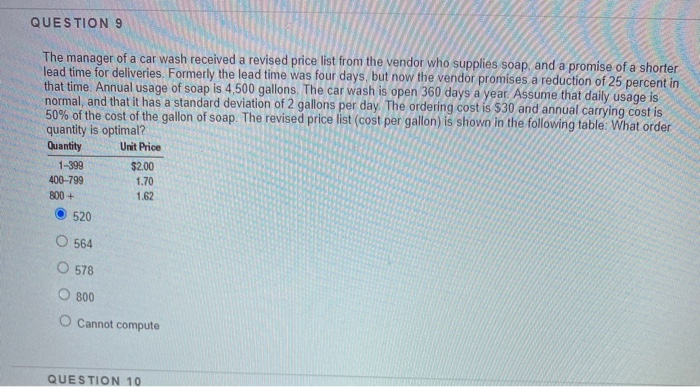
ques 9 ) The manager of a car wash received a revised price list from the vendor who supplies soap, and a promise of a shorter lead time for deliveries. Formerly the lead time was four days, but now the vendor promises a reduction of 25 percent in that time. Annual usage of soap is 4,500 gallons. The car wash is open 360 days a year. Assume that daily usage is normal, and that it has a standard deviation of 2 gallons per day. The ordering cost is $30 and annual carrying cost is 50% of the cost of the gallon of soap. The revised price list (cost per gallon) is shown in the following table: What order quantity is optimal?
options:
| 520 | ||
| 564 | ||
| 578 | ||
| 800 | ||
| Cannot compute |
Step by Step Solution
There are 3 Steps involved in it

Get step-by-step solutions from verified subject matter experts