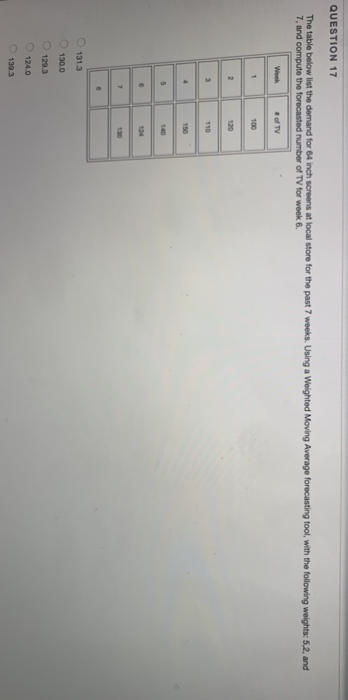
Question: QUESTION 17 The table below list the demand for 64 inch screens at local store for the past 7 weeks. Using a Weighted Moving Average

QUESTION 17 The table below list the demand for
QUESTION 17 The table below list the demand for 64 inch screens at local store for the past 7 weeks. Using a Weighted Moving Average forecasting tool, with the following weights: 6.2, and 7. and compute the forecasted number of TV for week 6. of TV 1 100 2 120 110 4 150 5 140 7 . 131.3 130.0 129.3 124.0 139.3 QUESTION 18 5 Precision Instrument uses a P-Chart to monitor the quality of their microscope lenses. Each day they inspect sixty lenses. Below is the number of defective lenses found over the last 10 days. With this information, 0.3% Risk level, compute the control chart limits. Day #Defects Day # Defects 6 2 2 2 7 6 3 3 8 4 4 2 2 5 1 10 -0.0637 5 0.029 0.0533 0.00 0.087 QUESTION 19 The manager of a car wash received a revised price list from the vendor who supplies soap, and a promise of a shorter lead time for deliveries. Formerly the lead time was four days, but now the vendor promises a reduction of 25 percent in that time. Annual usage of soap is 4,500 gallons. The car wash is open 360 days a year. Assume that daily usage is normal, and that it has a standard deviation of 2 gallons per day. The ordering cost is $30 and annual carrying cost is 50% of the cost of the gallon of soap. The revised price list (cost per gallon) is shown in the following table: What order quantity is optimal? Quantity Unit Price 1-399 32.00 400-799 1.70 800+ 520 584 578 800 Cannot compute

Step by Step Solution

There are 3 Steps involved in it

1 Expert Approved Answer
Step: 1 Unlock blur-text-image
Question Has Been Solved by an Expert!

Get step-by-step solutions from verified subject matter experts

Step: 2 Unlock
Step: 3 Unlock

Students Have Also Explored These Related General Management Questions!