

Question: 4. This question is based on data for a random sample of 638 air routes in the United States collected by a Smith School faculty
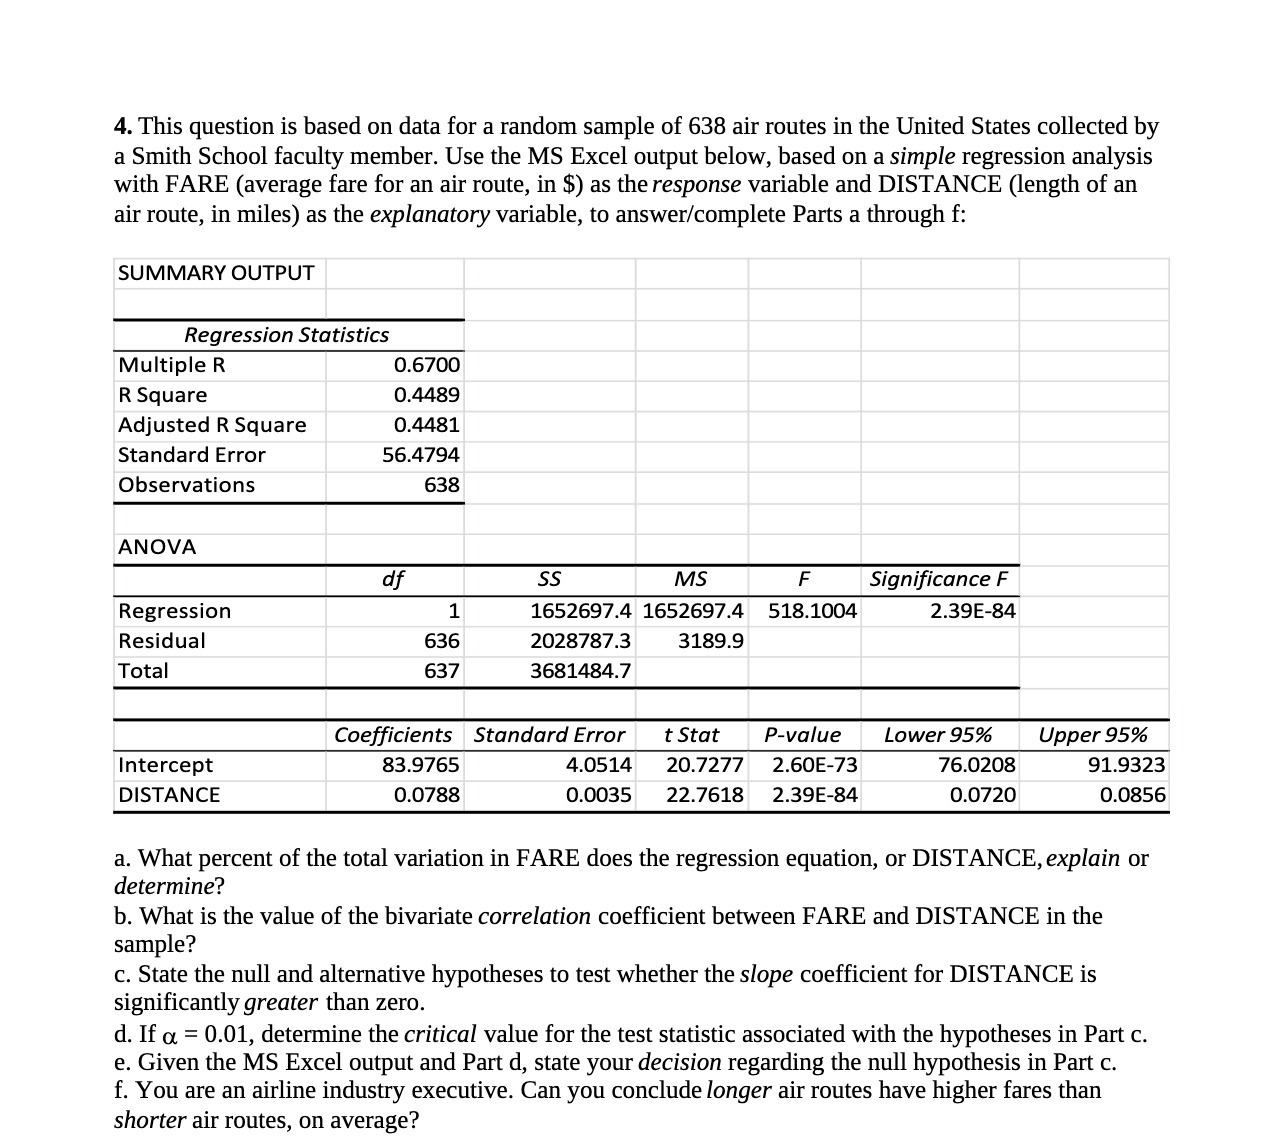
4. This question is based on data for a random sample of 638 air routes in the United States collected by a Smith School faculty member. Use the MS Excel output below, based on a simple regression analysis with FARE (average fare for an air route, in $) as the response variable and DISTANCE (length of an air route, in miles) as the explanatory variable, to answerfcomplete Parts a through f: SUMMARY OUTPUT Regression Sta tistics Multiple R 0.6700 R Square 0.4489 Adjusted R Square 0.4481 Standard Error 56.4794 Observations 638 ANOVA 60' Regression 1 Residual 636 Total 637 Coe'icients Intercept 83.9765 DISTANCE 0.0788 55 MS F Signicance F 16526974 16526974 5181004 2.39E84 20287873 3189.9 3681484.? Standard Error t .5th Pvoiue Lower 95% Upper 95% 4.05 14 20.7 277 2.60 E-73 76.0208 91.93 23 0.0035 22.7618 2.39 E-84 0.0720 0.0856 a. What percent of the total variation in FARE does the regression equation, or DISTANCE, explain or determine? b. What is the value of the bivariate correlation coefficient between FARE and DISTANCE in the sample? c. State the null and alternative hypotheses to test whether the slope coefficient for DISTANCE is significantly greater than zero. d. If (1 = 0.01, determine the critical value for the test statistic associated with the hypotheses in Part c. e. Given the MS Excel output and Part d, state your decision regarding the null hypothesis in Part c. f. You are an airline industry executive. Can you conclude longer air routes have higher fares than shorter air routes, on average
Step by Step Solution
There are 3 Steps involved in it

Get step-by-step solutions from verified subject matter experts