

Question: 4. Use the following stem 8: leaf diagram to answer the following questions: 1 3 7 7 8 9 9 2 1 3 4 8

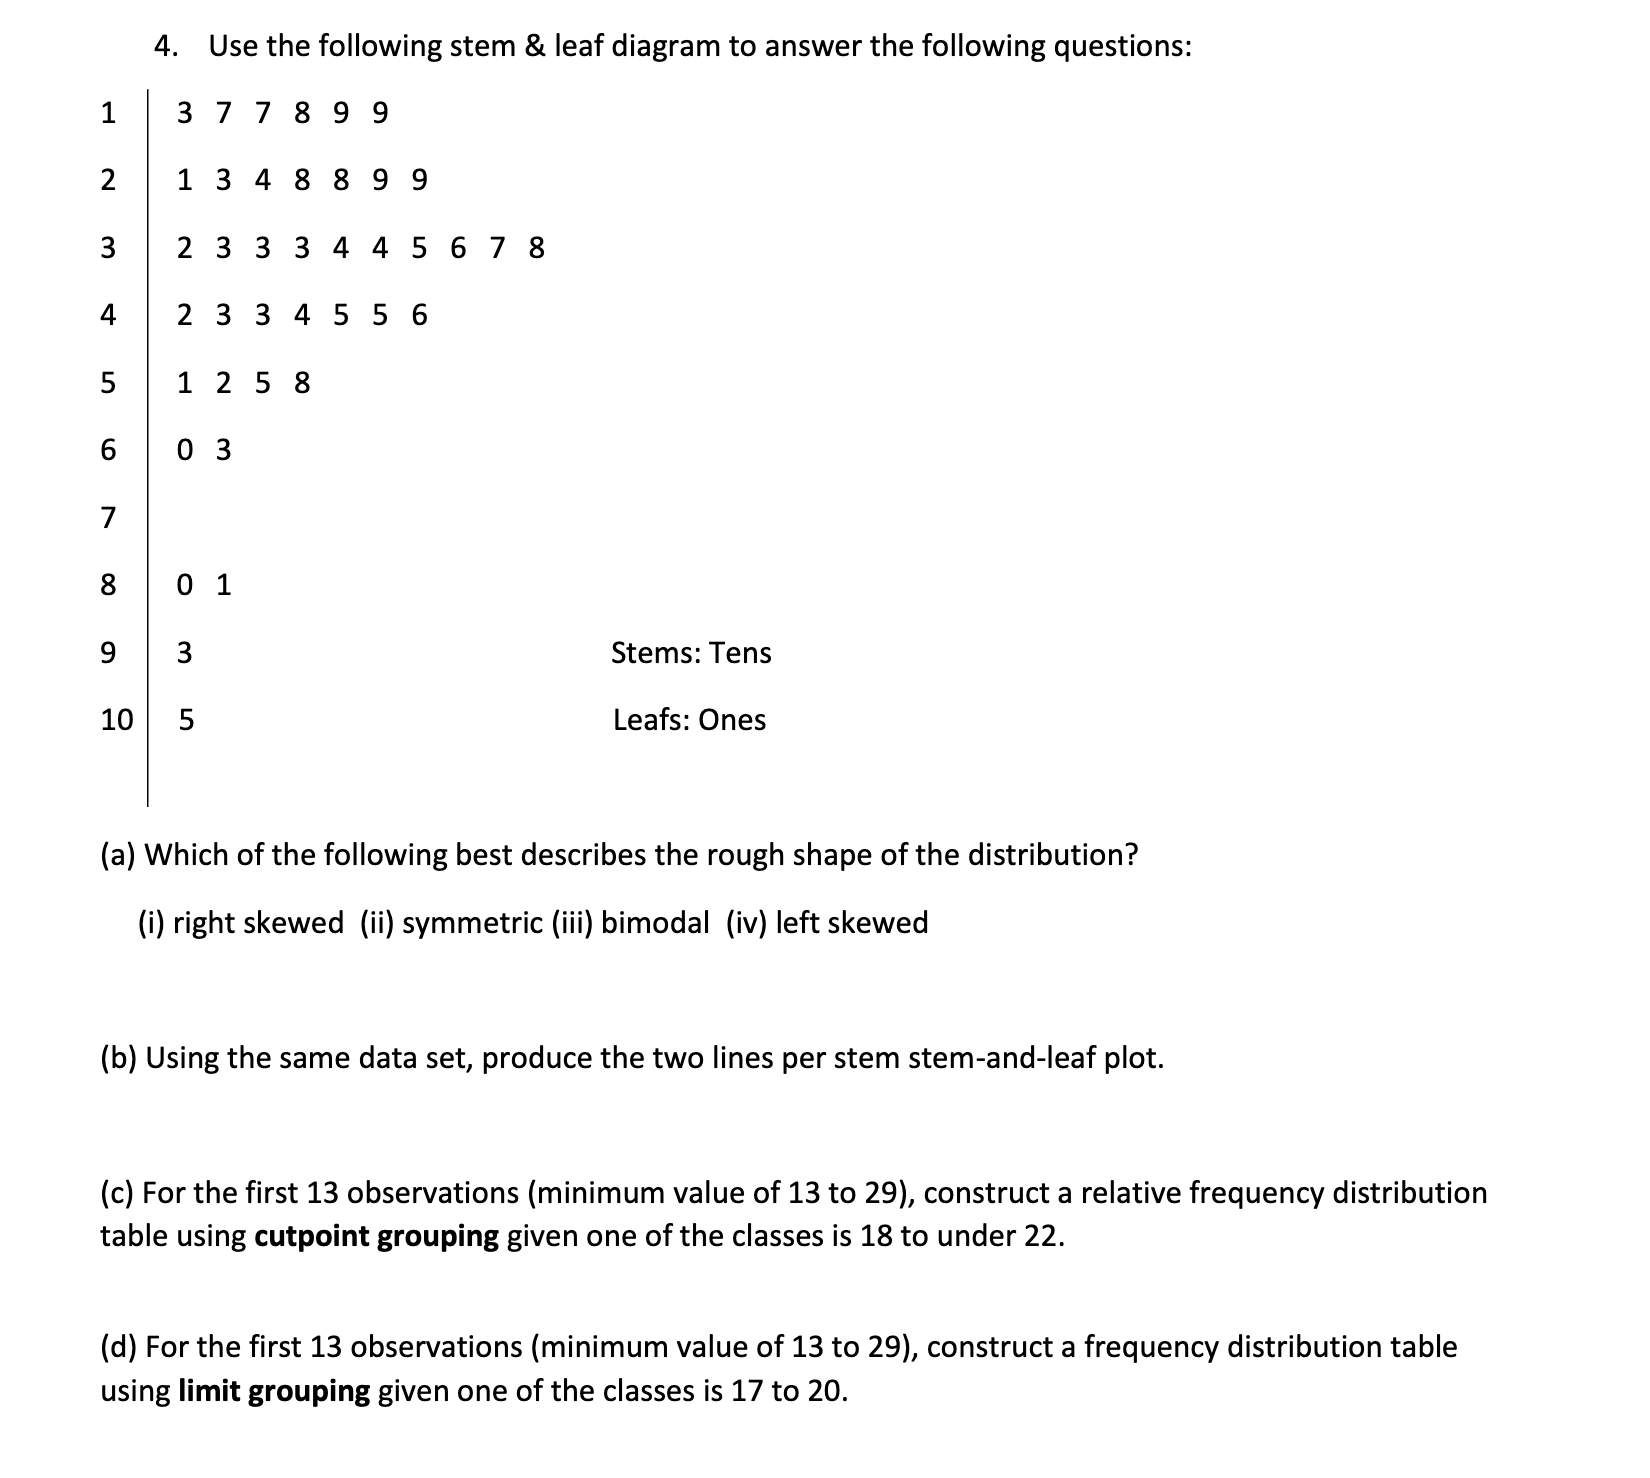
4. Use the following stem 8: leaf diagram to answer the following questions: 1 3 7 7 8 9 9 2 1 3 4 8 8 9 9 3 2 3 3 3 4 4 5 6 7 8 4 2 3 3 4 5 5 6 5 1 2 5 8 6 0 3 7 8 0 1 9 3 StemszTens 10 5 Leafs: Ones (a) Which of the following best describes the rough shape of the distribution? (i) right skewed (ii) symmetric (iii) bimodal (iv) left skewed (b) Using the same data set, produce the two lines per stem stem-and-leaf plot. (c) For the first 13 observations (minimum value of 13 to 29), construct a relative frequency distribution table using cutpoint grouping given one of the classes is 18 to under 22. (d) For the first 13 observations (minimum value of 13 to 29), construct a frequency distribution table using limit grouping given one of the classes is 17 to 20
Step by Step Solution
There are 3 Steps involved in it

Get step-by-step solutions from verified subject matter experts