

Question: 4. Use the output on the right to answer the questions below. a. What is your conclusion based on the displayed p- value? b. Use
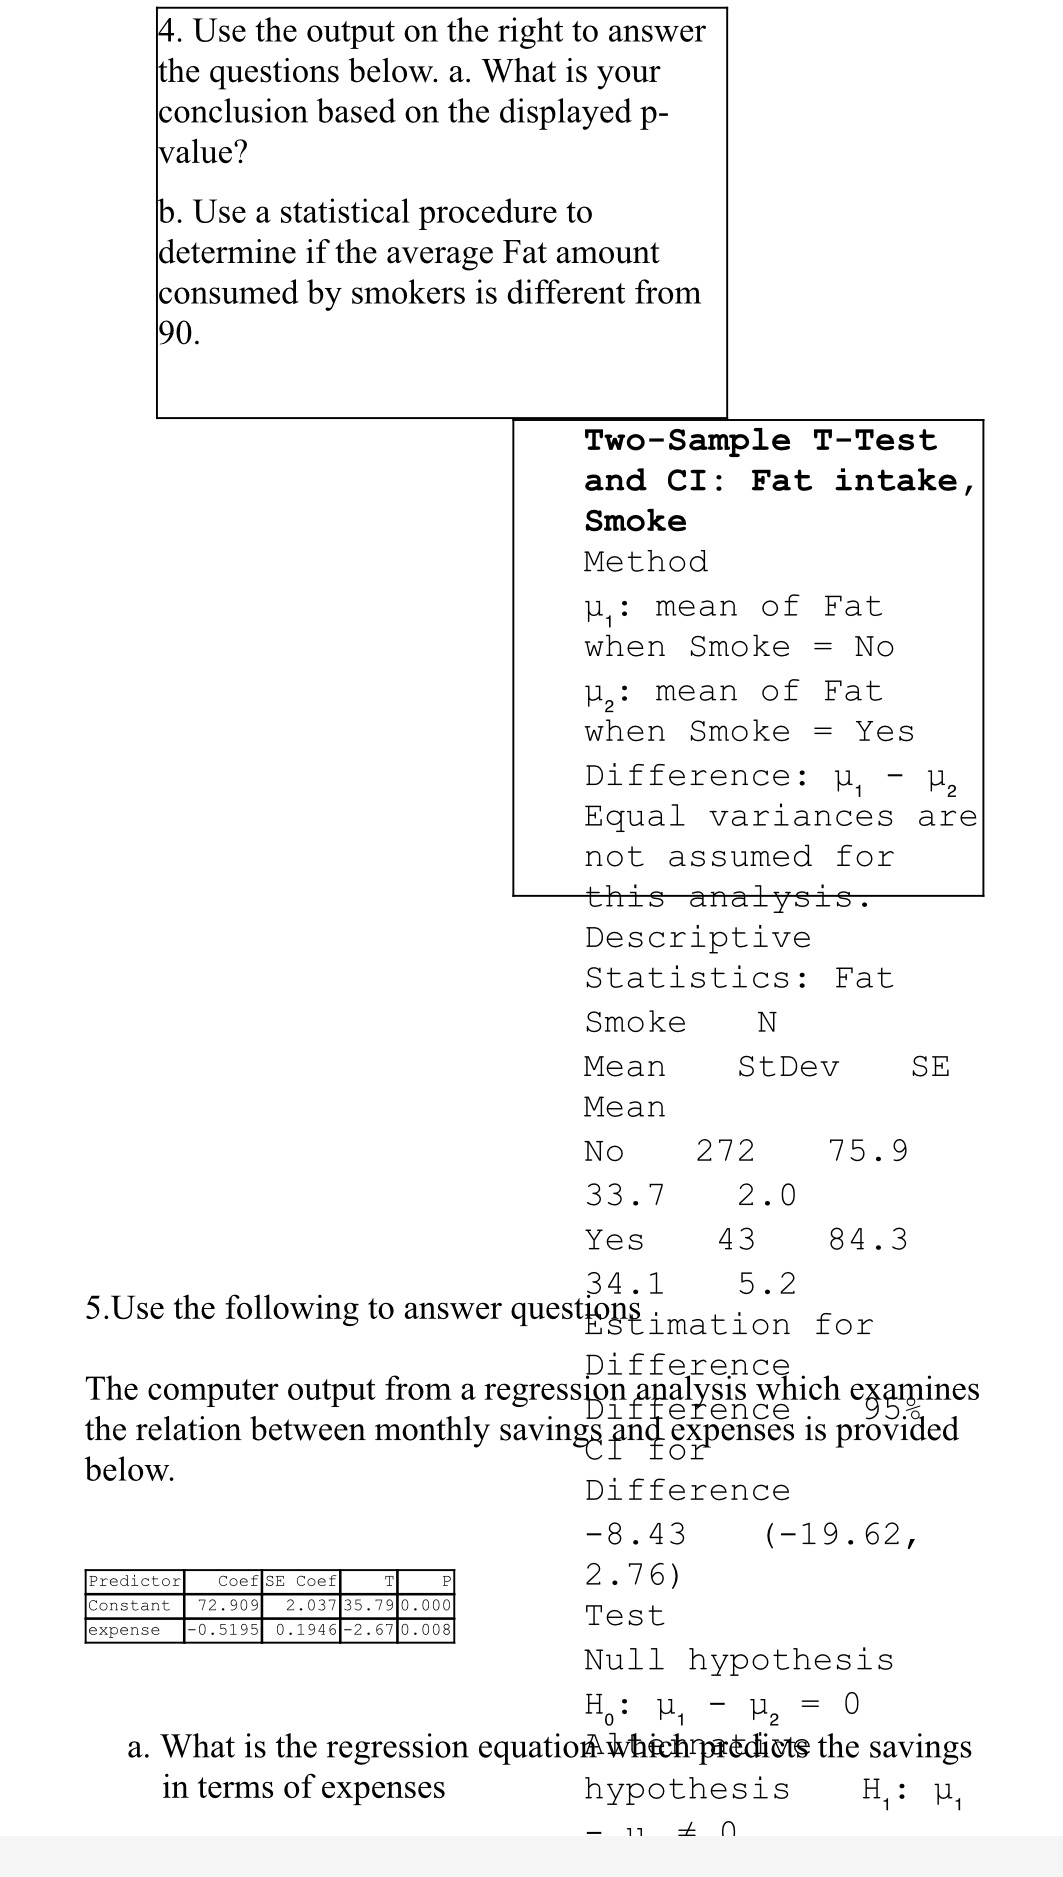
4. Use the output on the right to answer the questions below. a. What is your conclusion based on the displayed p- value? b. Use a statistical procedure to determine if the average Fat amount consumed by smokers is different from 90. Two-Sample T-Test and CI: Fat intake, Smoke Method u : mean of Fat when Smoke = No H,: mean of Fat when Smoke = Yes Difference: M - 2 Equal variances are not assumed for this analysis. Descriptive Statistics: Fat Smoke N Mean StDev SE Mean No 272 75.9 33 . 7 2.0 Yes 43 84.3 34.1 5 . 2 5.Use the following to answer questions Estimation for Difference The computer output from a regression analysis which examines the relation between monthly savings and expenses is provided below. Difference -8 . 43 (-19. 62, Predictor Coef SE Coef T 2. 76) Constant 72. 909 2. 037 35. 79 0.000 Test expense -0 . 5195 0 . 1946 -2. 67 0 . 008 Null hypothesis H : M - U 2 = 0 a. What is the regression equation which predicts the savings in terms of expenses hypothesis H : M , 17 # n
Step by Step Solution
There are 3 Steps involved in it

Get step-by-step solutions from verified subject matter experts