

Question: 4. Using the data recorded in Table 4, graphically and mathematically determine the relationship between the pump command signal (V) and its pumping capacity (Ipm).

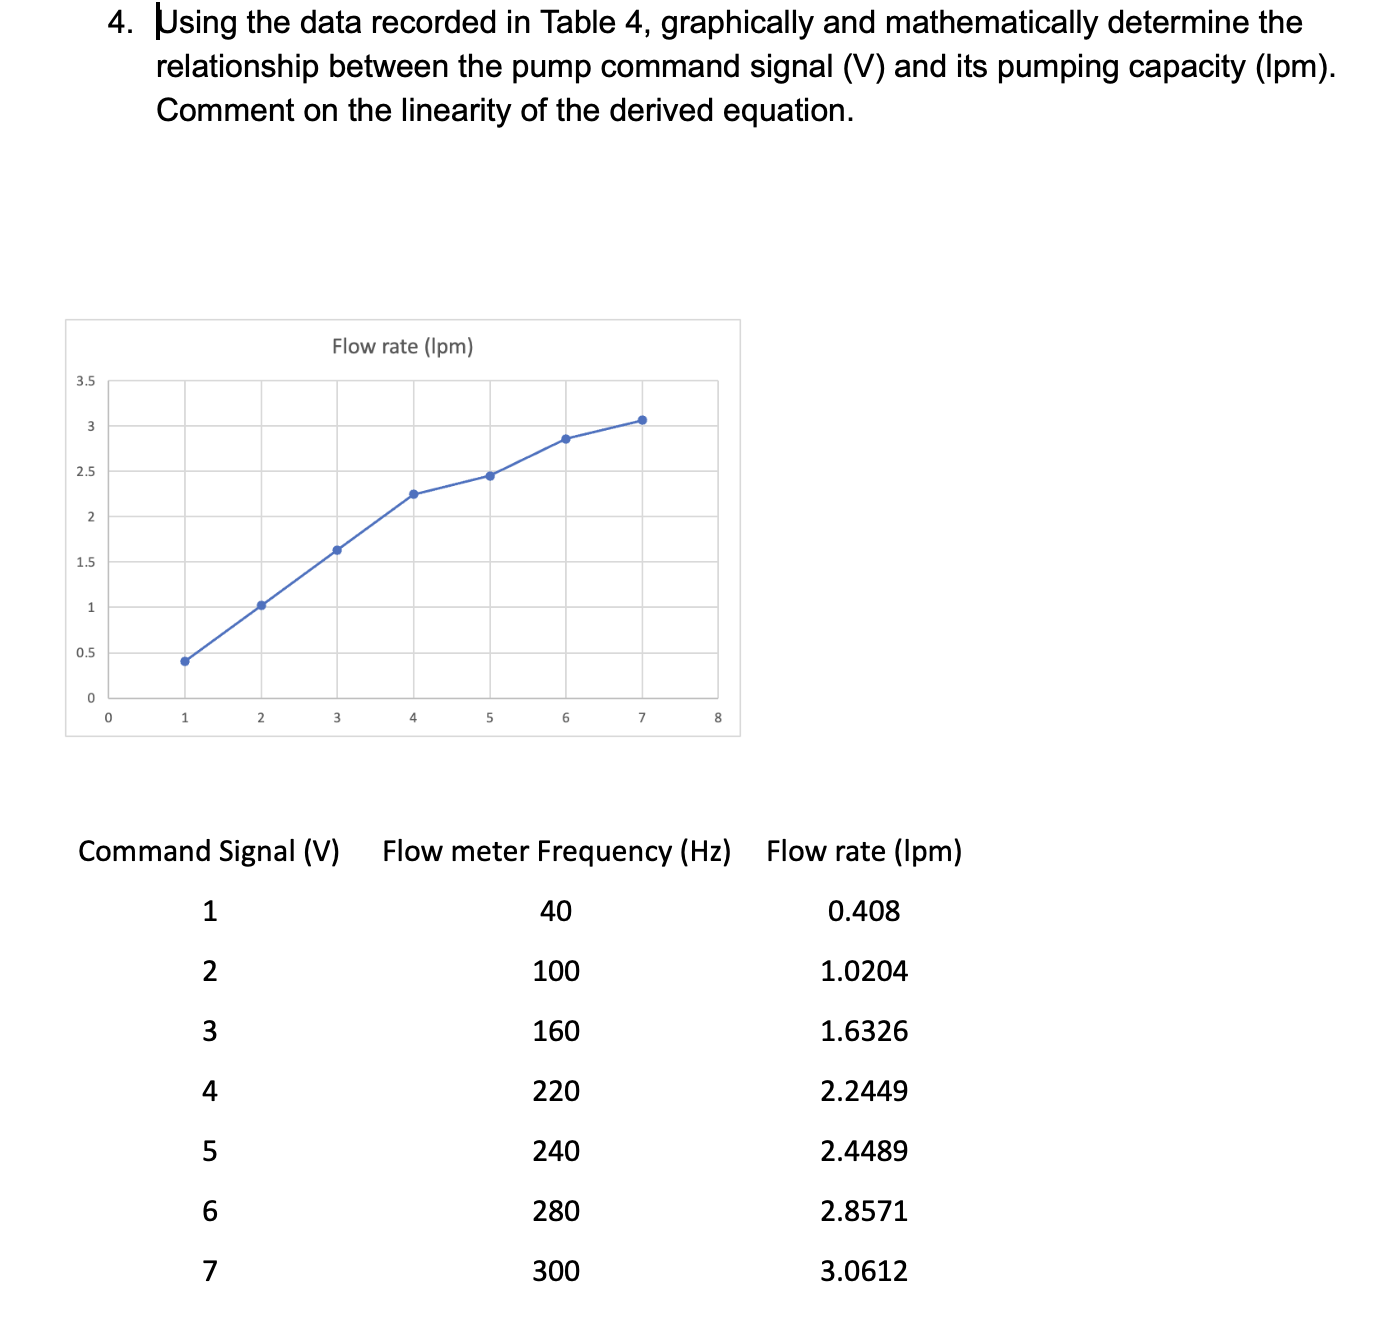
4. Using the data recorded in Table 4, graphically and mathematically determine the relationship between the pump command signal (V) and its pumping capacity (Ipm). Comment on the linearity of the derived equation. Flow rate (Ipm) 3.5 w 2.5 N 1.5 0.5 0 Command Signal (V) Flow meter Frequency (Hz) Flow rate (Ipm) 40 0.408 N 100 1.0204 160 1.6326 220 2.2449 240 2.4489 vauI 280 2.8571 300 3.0612
Step by Step Solution
There are 3 Steps involved in it
1 Expert Approved Answer
Step: 1 Unlock

Question Has Been Solved by an Expert!
Get step-by-step solutions from verified subject matter experts
Step: 2 Unlock
Step: 3 Unlock