

Question: 4. Wait Test.vi Write a program that iterates the following task N = 10,000 times: During the ith iteration, execute the Wait (ms) icon
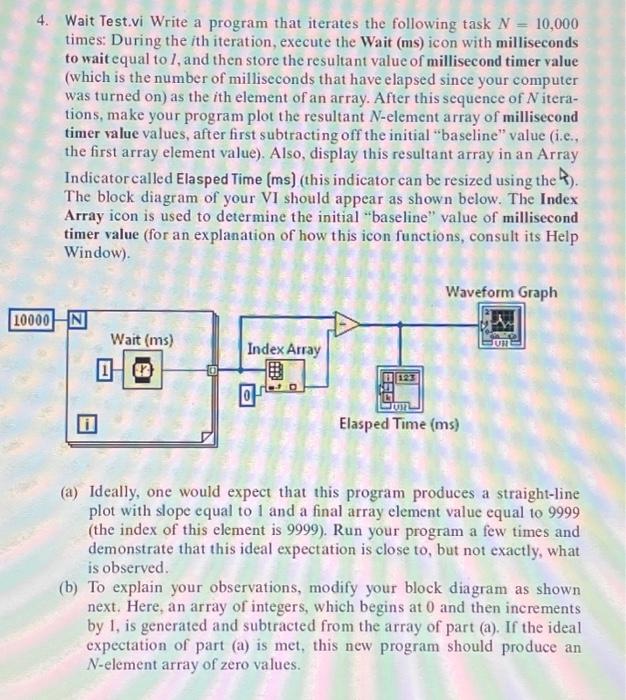
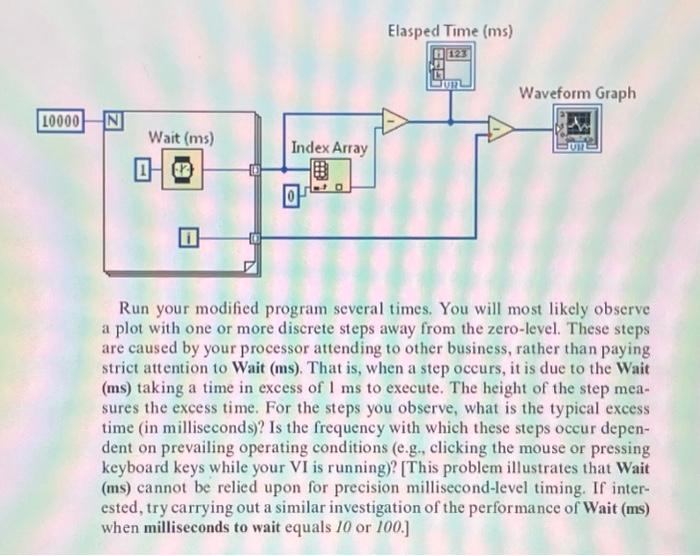
4. Wait Test.vi Write a program that iterates the following task N = 10,000 times: During the ith iteration, execute the Wait (ms) icon with milliseconds to wait equal to 1, and then store the resultant value of millisecond timer value (which is the number of milliseconds that have elapsed since your computer was turned on) as the ith element of an array. After this sequence of Nitera- tions, make your program plot the resultant N-element array of millisecond timer value values, after first subtracting off the initial "baseline" value (i.e., the first array element value). Also, display this resultant array in an Array Indicator called Elasped Time (ms) (this indicator can be resized using the ). The block diagram of your VI should appear as shown below. The Index Array icon is used to determine the initial "baseline" value of millisecond timer value (for an explanation of how this icon functions, consult its Help Window). 10000 Wait (ms) 10 Index Array 123 Waveform Graph Elasped Time (ms) JUR (a) Ideally, one would expect that this program produces a straight-line plot with slope equal to 1 and a final array element value equal to 9999 (the index of this element is 9999). Run your program a few times and demonstrate that this ideal expectation is close to, but not exactly, what is observed. (b) To explain your observations, modify your block diagram as shown next. Here, an array of integers, which begins at 0 and then increments by 1, is generated and subtracted from the array of part (a). If the ideal expectation of part (a) is met, this new program should produce an N-element array of zero values. LO000 Wait (ms) Index Array 8 Elasped Time (ms) 11123 13 JUBL Waveform Graph Run your modified program several times. You will most likely observe a plot with one or more discrete steps away from the zero-level. These steps are caused by your processor attending to other business, rather than paying strict attention to Wait (ms). That is, when a step occurs, it is due to the Wait (ms) taking a time in excess of 1 ms to execute. The height of the step mea- sures the excess time. For the steps you observe, what is the typical excess time (in milliseconds)? Is the frequency with which these steps occur depen- dent on prevailing operating conditions (e.g., clicking the mouse or pressing keyboard keys while your VI is running)? [This problem illustrates that Wait (ms) cannot be relied upon for precision millisecond-level timing. If inter- ested, try carrying out a similar investigation of the performance of Wait (ms) when milliseconds to wait equals 10 or 100.]
Step by Step Solution
There are 3 Steps involved in it

Get step-by-step solutions from verified subject matter experts