

Question: 4. What do you miss in the histogram? Make a histogram of the mean annual temperatures at Pasadena for the years 1951 to 2000. (Data
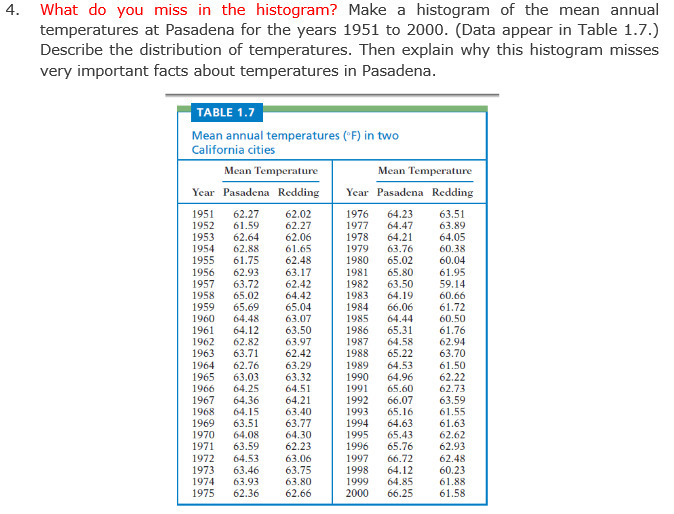
4. What do you miss in the histogram? Make a histogram of the mean annual temperatures at Pasadena for the years 1951 to 2000. (Data appear in Table 1.7.) Describe the distribution of temperatures. Then explain why this histogram misses very important facts about temperatures in Pasadena. TABLE 1.7 Mean annual temperatures ("F) in two California cities Mean Temperature Mean Temperature Year Pasadena Redding Year Pasadena Redding 1951 62.27 62.02 1952 1976 61.59 64.23 62.27 63.51 1953 1977 62.64 64.47 63.89 62.06 1954 62.88 1978 64.21 1955 61.65 61.75 1979 64.05 63.76 62.48 60.38 1956 1980 62.93 65.02 60.04 1957 63.72 63.17 1981 62.42 65.80 1982 61.95 1958 65.02 63.50 59.14 1959 64.42 1983 65.69 65.04 64.19 60.66 1960 64.48 1984 63.07 66.06 1961 64.12 1985 64.44 61.72 62.82 63.50 60.50 1962 1986 65.31 1963 63.97 61.76 63.71 1987 64.58 62.42 62.94 1988 1964 65.22 62.76 63.29 63.70 1965 1989 63.03 63.32 64.53 1990 61.50 1966 64.25 64.51 64.96 1991 62.22 1967 64.36 65.60 62.73 1968 64.15 64.21 1992 66.07 1993 63.59 1969 63.51 63.40 1994 65.16 61.55 1970 63.77 64.08 64.63 1971 64.30 1995 61.63 63.59 65.43 62.23 1996 62.62 1972 64.53 65.76 1973 63.06 62.93 63.46 1997 63.75 66.72 62.48 1974 63.93 1998 63.80 64.12 1975 1999 64.85 60.23 62.36 62.66 2000 61.88 66.25 61.58
Step by Step Solution
There are 3 Steps involved in it

Get step-by-step solutions from verified subject matter experts