

Question: 4. You have completed an enterprise risk management (ERM) First-Filter risk assessment identifying 85 risks across the corporation. The Chief Risk Officer (CRO) requested three
4. You have completed an enterprise risk management (ERM) First-Filter risk assessment identifying 85 risks across the corporation. The Chief Risk Officer (CRO) requested three Second-Filter ROI analyses including: (1) Manufacturing Contamination Risk; (2) Geopolitical Risk; and, (3) Cyber Security Risk. You have performed the three Second-Filter analyses yielding the following table of results. Risk Expected NPV Before Invest ($M) Expected Gain ($M) Investment Investment ($M) Productivity Expected NPV After Invest Risk Expected NPV Before Invest ($M) Expected Gain ($M) Investment Investment ($M) Productivity Expected NPV After Invest.
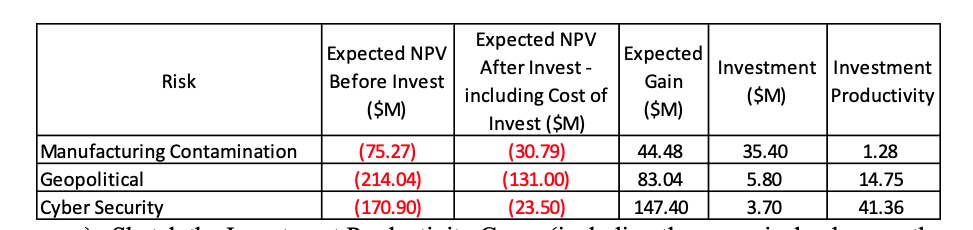
a) Sketch the Investment Productivity Curve (including the numerical values on the axes).
Risk Expected NPV Before Invest ($M) Expected Gain ($M) Investment Investment ($M) Productivity Expected NPV After Invest - including Cost of Invest (SM) (30.79) (131.00) (23.50) Manufacturing Contamination Geopolitical Cyber Security (75.27) (214.04) (170.90) 44.48 83.04 147.40 35.40 5.80 3.70 1.28 14.75 41.36
Step by Step Solution
There are 3 Steps involved in it

Get step-by-step solutions from verified subject matter experts