

Question: 40 35 All Times 30 - -+ 25- -+ 8 20 - 9 15 - + 10 Model 1 Model2 BodyDesign 11 b. Construct the
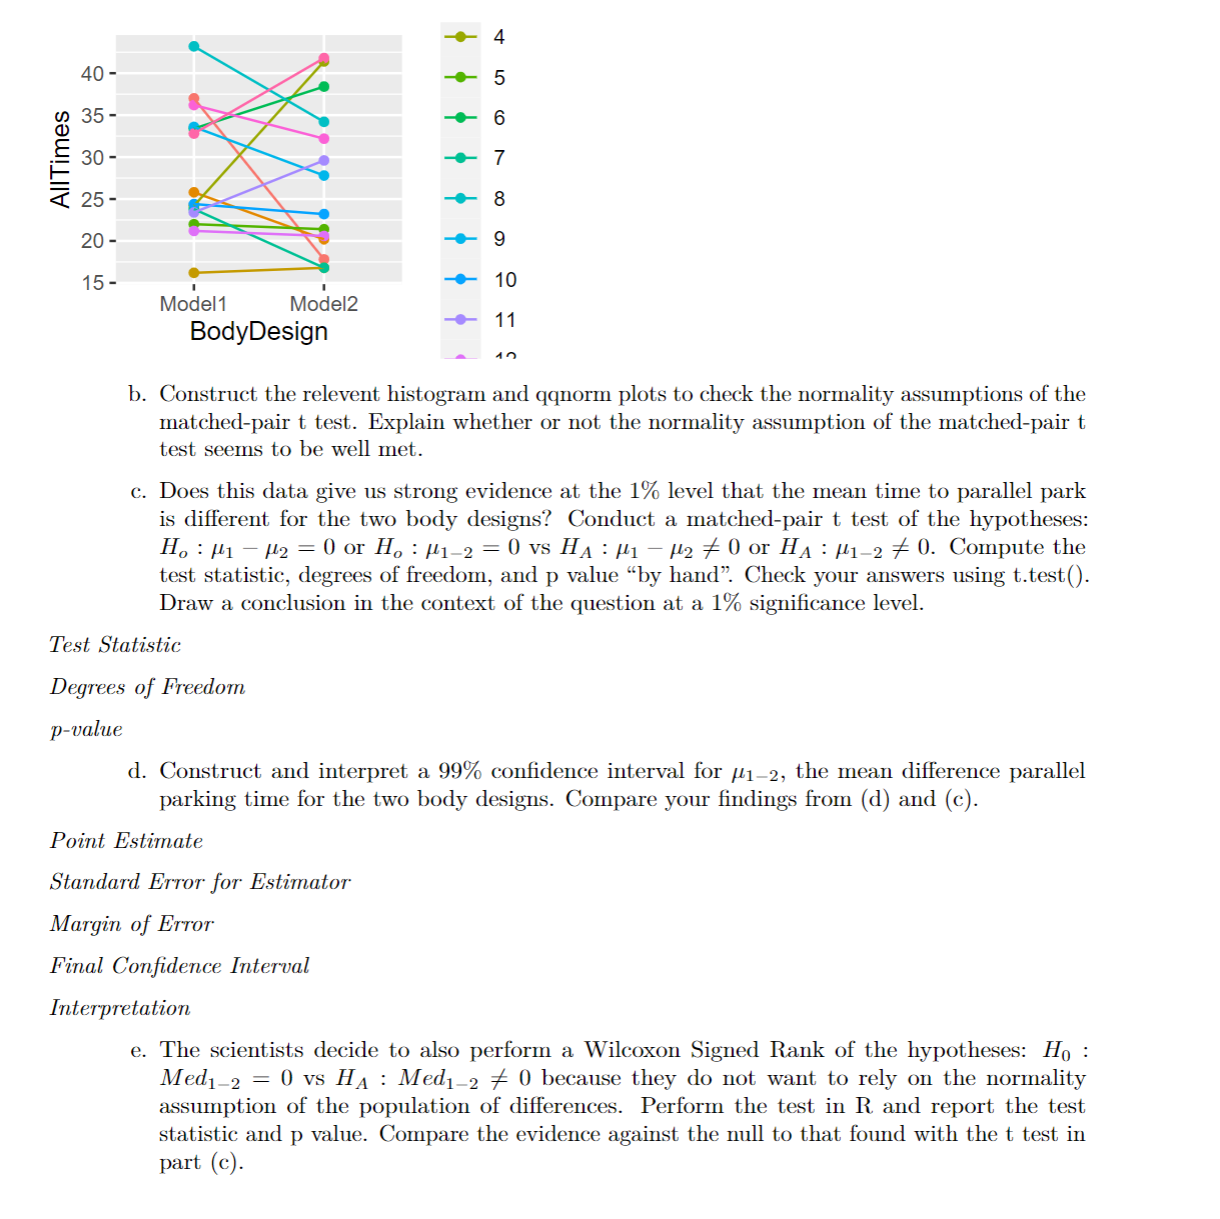
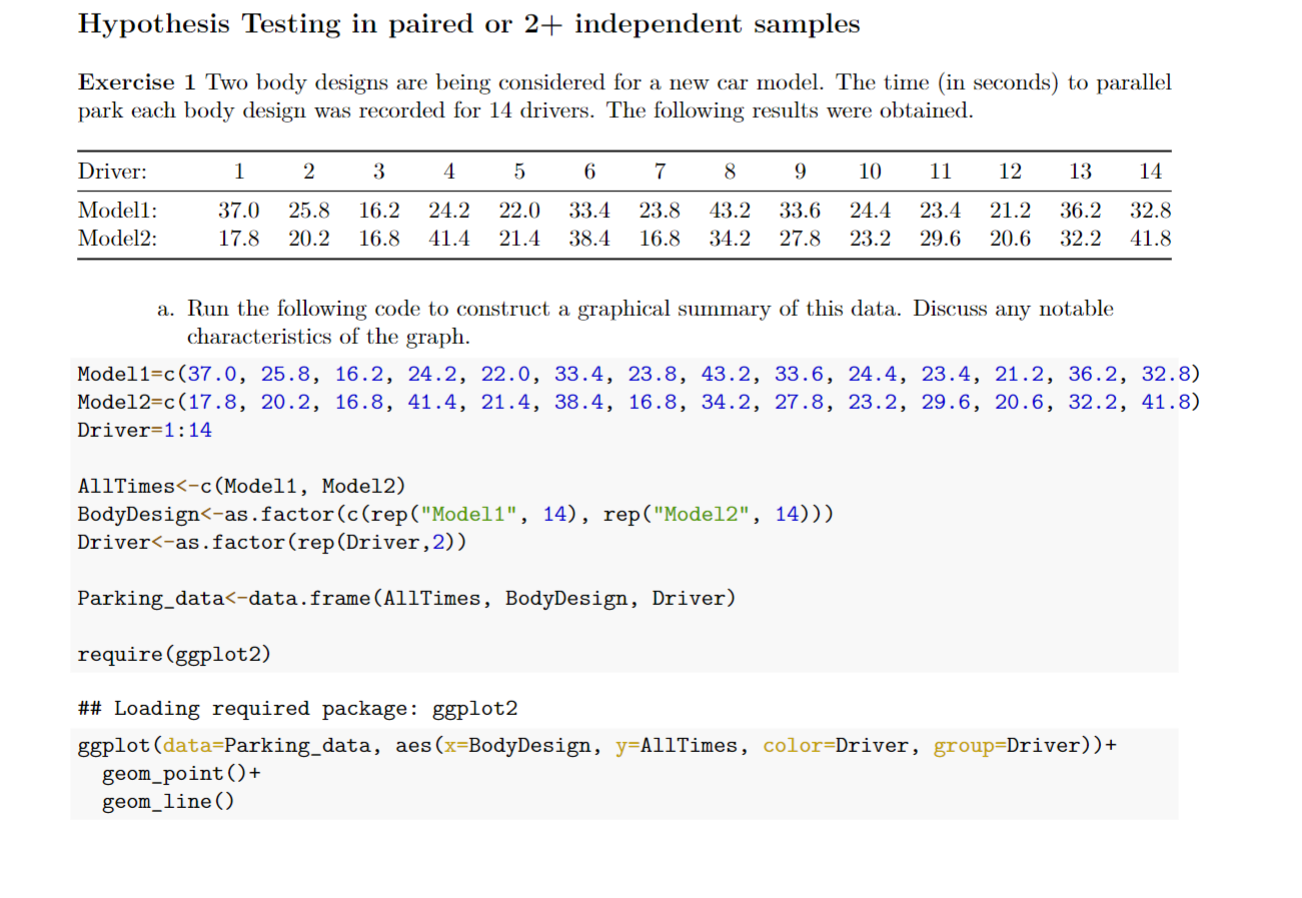
40 35 All Times 30 - -+ 25- -+ 8 20 - 9 15 - + 10 Model 1 Model2 BodyDesign 11 b. Construct the relevent histogram and qqnorm plots to check the normality assumptions of the matched-pair t test. Explain whether or not the normality assumption of the matched-pair t test seems to be well met. c. Does this data give us strong evidence at the 1% level that the mean time to parallel park is different for the two body designs? Conduct a matched-pair t test of the hypotheses: Ho : #1 - 12 = 0 or Ho : #1-2 = 0 vs HA : #1 - H2 / 0 or HA : #1-2 7 0. Compute the test statistic, degrees of freedom, and p value "by hand". Check your answers using t.test(). Draw a conclusion in the context of the question at a 1% significance level. Test Statistic Degrees of Freedom p-value d. Construct and interpret a 99% confidence interval for #1-2, the mean difference parallel parking time for the two body designs. Compare your findings from (d) and (c). Point Estimate Standard Error for Estimator Margin of Error Final Confidence Interval Interpretation e. The scientists decide to also perform a Wilcoxon Signed Rank of the hypotheses: Ho : Med1-2 = 0 vs HA : Med1-2 + 0 because they do not want to rely on the normality assumption of the population of differences. Perform the test in R and report the test statistic and p value. Compare the evidence against the null to that found with the t test in part (c).Hypothesis Testing in paired or 2+ independent samples Exercise 1 Two body designs are being considered for a new car model. The time (in seconds) to parallel park each body design was recorded for 14 drivers. The following results were obtained. Driver: 1 2 3 4 5 6 7 8 9 10 11 12 13 14 Modell: 37.0 25.8 16.2 24.2 22.0 33.4 23.8 43.2 33.6 24.4 23.4 21.2 36.2 32.8 Model2: 17.8 20.2 16.8 41.4 21.4 38.4 16.8 34.2 27.8 23.2 29.6 20.6 32.2 41.8 a. Run the following code to construct a graphical summary of this data. Discuss any notable characteristics of the graph. Model1=c (37 .0, 25.8, 16.2, 24.2, 22.0, 33.4, 23.8, 43.2, 33.6, 24.4, 23.4, 21.2, 36.2, 32.8) Model2=c (17.8, 20.2, 16.8, 41.4, 21.4, 38.4, 16.8, 34.2, 27.8, 23.2, 29.6, 20.6, 32.2, 41.8) Driver=1 : 14 AllTimes
Step by Step Solution
There are 3 Steps involved in it

Get step-by-step solutions from verified subject matter experts