

Question: 40 I need help Test whether metnod 40 . The table below displays the performance of 10 randomly selected students on the SAT Verbal and
40 I need help
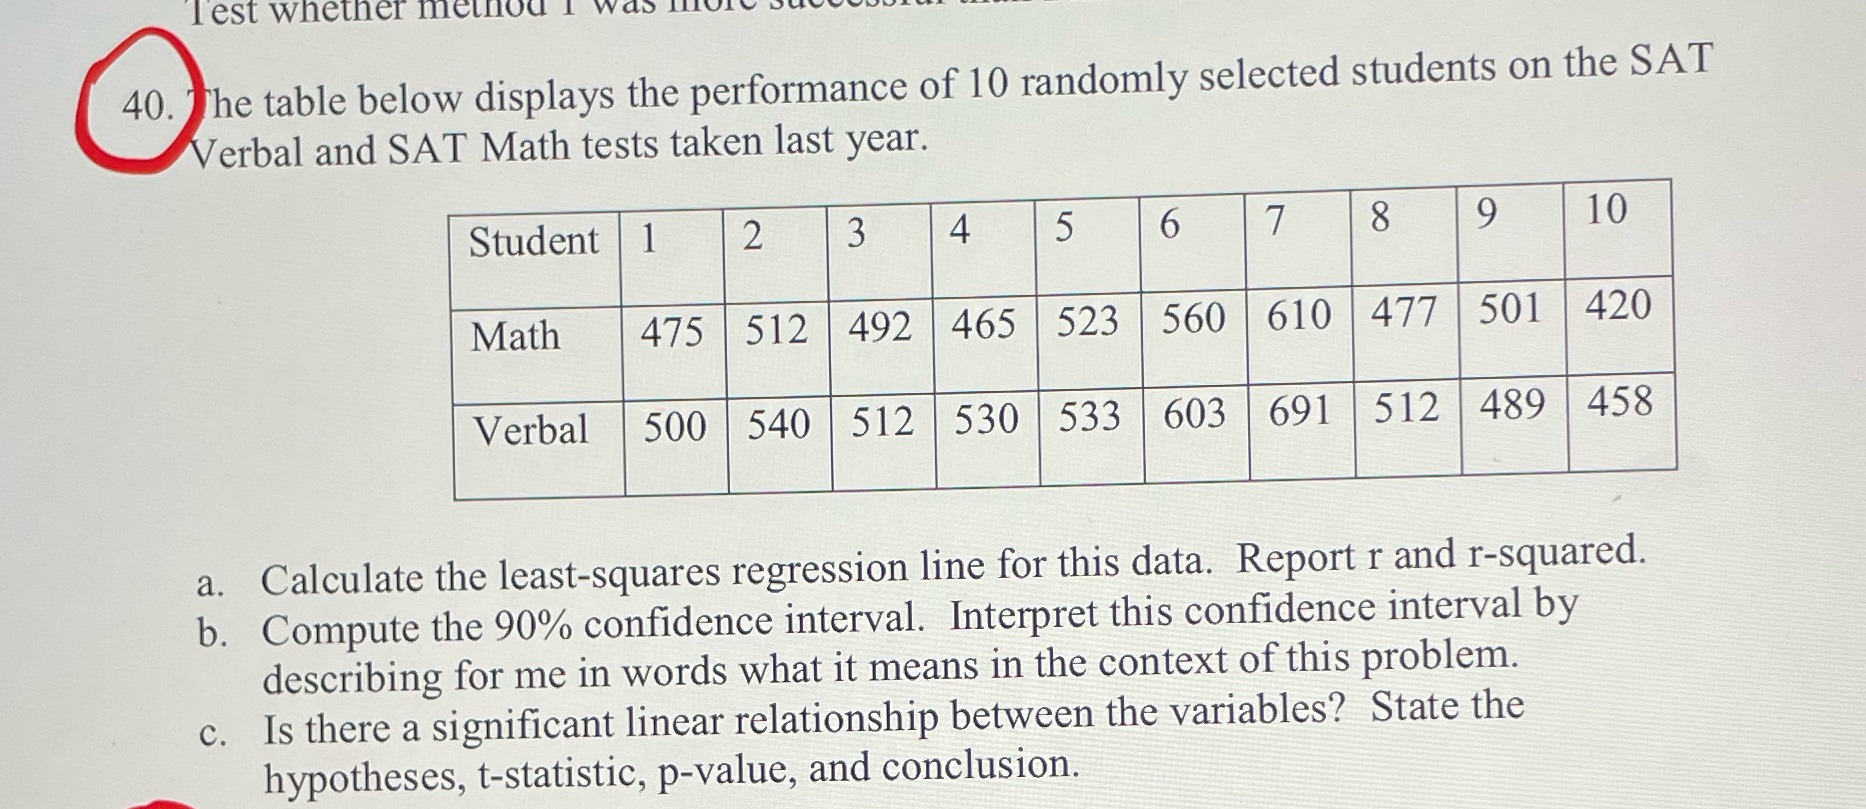
Test whether metnod 40 . The table below displays the performance of 10 randomly selected students on the SAT Verbal and SAT Math tests taken last year. Student 1 2 4 5 6 7 8 9 10 Math 475 512 492 465 523 560 610 477 501 420 Verbal 500 540 512 530 533 603 691 512 489 458 a. Calculate the least-squares regression line for this data. Report r and r-squared. b. Compute the 90% confidence interval. Interpret this confidence interval by describing for me in words what it means in the context of this problem. c. Is there a significant linear relationship between the variables? State the hypotheses, t-statistic, p-value, and conclusion
Step by Step Solution
There are 3 Steps involved in it

Get step-by-step solutions from verified subject matter experts