

Question: 40. With the following Proportion Run Chart (see graph below), why isn't the +- Sigma Limits (Other than the upper 3 sigma limit) NOT a

40. With the following Proportion Run Chart (see graph below), why isn't the +- Sigma Limits (Other than the upper 3 sigma limit) NOT a straight line, why do they appear jagged? a. Each calculation of 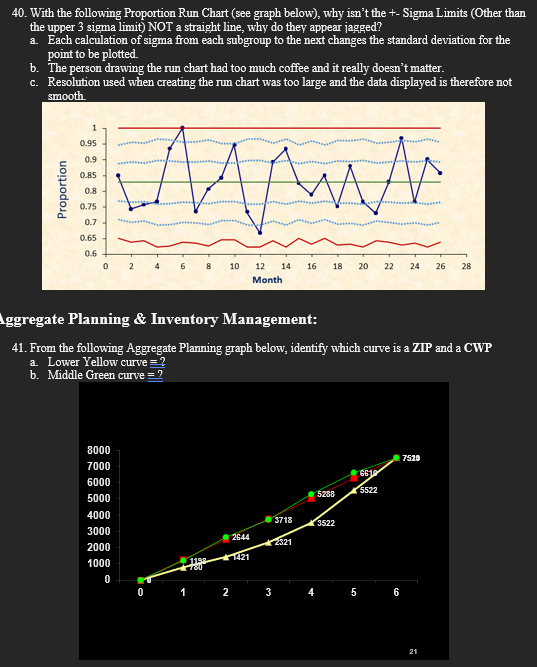
Step by Step Solution
There are 3 Steps involved in it
1 Expert Approved Answer
Step: 1 Unlock

Question Has Been Solved by an Expert!
Get step-by-step solutions from verified subject matter experts
Step: 2 Unlock
Step: 3 Unlock