

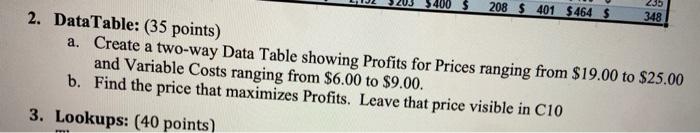
Question: $400 S 208 $ 401 $ 464 $ 235 348 2. DataTable: (35 points) a. Create a two-way Data Table showing Profits for Prices ranging
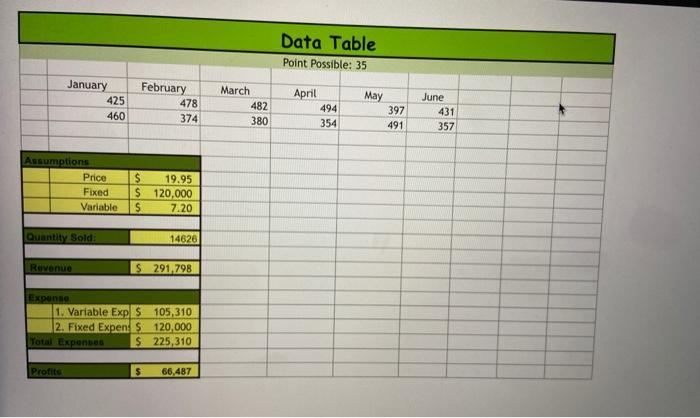
$400 S 208 $ 401 $ 464 $ 235 348 2. DataTable: (35 points) a. Create a two-way Data Table showing Profits for Prices ranging from $19.00 to $25.00 and Variable Costs ranging from $6.00 to $9.00. b. Find the price that maximizes Profits. Leave that price visible in C10 3. Lookups: (40 points) Data Table Point Possible: 35 January 425 460 February 478 374 May March 482 380 April 494 354 397 491 June 431 357 Assumptions Price Fixed Variable onun $ 19.95 $ 120,000 7.20 Quantity Sold 14626 Revenue S 291,798 Expono 1. Variable Exp $ 105,310 2. Fixed Expen: $ 120,000 Total Expenses $ 225,310 Profits $ 66.487
Step by Step Solution
There are 3 Steps involved in it
1 Expert Approved Answer
Step: 1 Unlock

Question Has Been Solved by an Expert!
Get step-by-step solutions from verified subject matter experts
Step: 2 Unlock
Step: 3 Unlock